Introduction to knowledge graphs (part 6): Summary and conclusion
This article is part 6 (and the final part) of the Introduction to knowledge graphs series of articles.
Recent research1 has identified the development of knowledge graphs as an important aspect of artificial intelligence (AI) in knowledge management (KM). The same research also recommended the training of knowledge scientists who can build knowledge graphs that represent background knowledge and that complement training data.
To assist in advancing AI in KM, this 6-part series of articles has provided an introduction to knowledge graphs.
Part 1 defines knowledge graphs and summarizes their applications. Two definitions are put forward – one general, and the other technical. The “knowledge” in the term “knowledge graphs” refers to what Nonaka and Takeuchi call “explicit knowledge,” that is, something that is known and can be written down. The recent applications of knowledge graphs include organizing knowledge over the internet, data integration in enterprises, and artificial intelligence.
Part 2 charts the history of knowledge graphs, an awareness of which is considered very important.
Parts 3, 4, and 5 then draw on Hogan and colleagues’ comprehensive tutorial article2 and other research to provide an introduction to the technical aspects of knowledge graphs. To keep the discussion accessible, Hogan and colleagues’ present concrete examples for a hypothetical knowledge graph, which are reproduced in parts 3, 4, and 5. This hypothetical knowledge graph relates to tourism in Chile.
Part 3 outlines graph data models and the languages used to query and validate them.
Part 4 present deductive formalisms by which knowledge can be represented and entailed.
Part 5 describes inductive techniques by which additional knowledge can be extracted.
Knowledge graphs serve as a common substrate of knowledge within an organisation or community, enabling the representation, accumulation, curation, and dissemination of knowledge over time. In this role, knowledge graphs have been applied for diverse use-cases, ranging from commercial applications – involving semantic search, user recommendations, conversational agents, targeted advertising, transport automation, and so on – to open knowledge graphs made available for the public good.
General trends include the use of knowledge graphs to integrate and leverage data from diverse sources at large scale, and the combination of deductive (rules, ontologies, etc.) and inductive techniques (machine learning, analytics, etc.) to represent and accumulate knowledge.
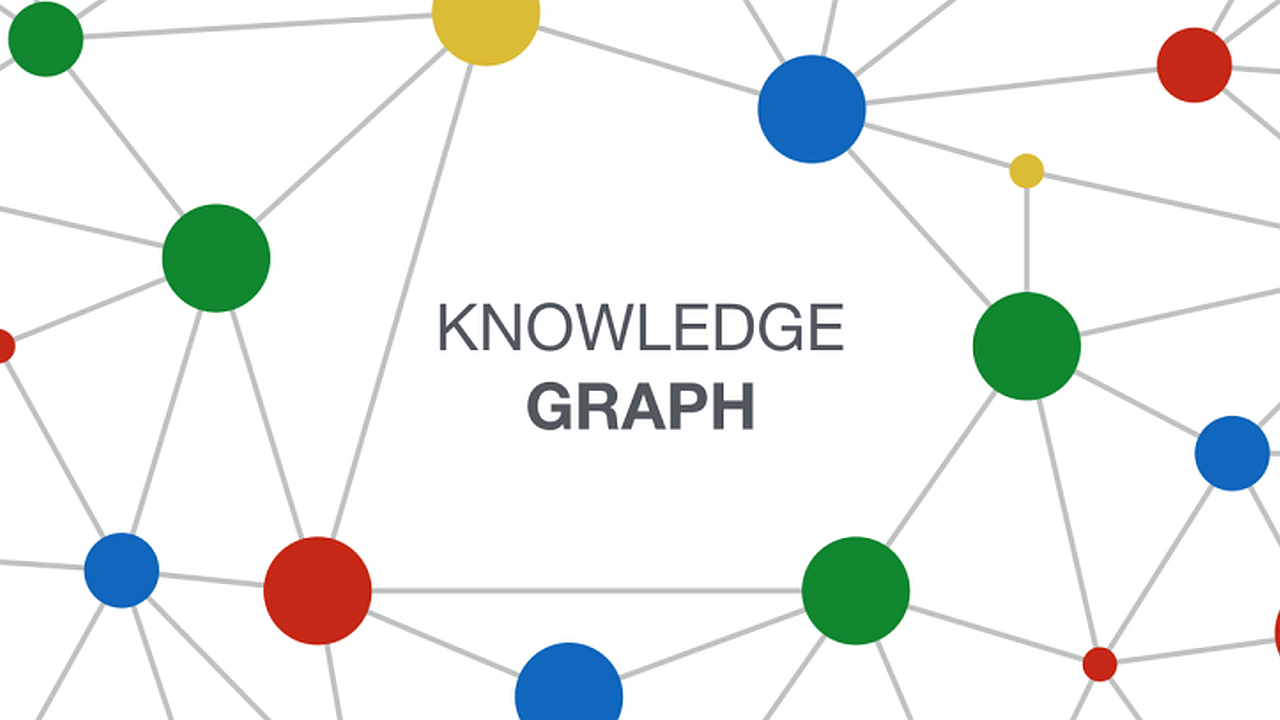
Header image source: Crow Intelligence, CC BY-NC-SA 4.0.
References:
- Jarrahi, M. H., Askay, D., Eshraghi, A., & Smith, P. (2023). Artificial intelligence and knowledge management: A partnership between human and AI. Business Horizons, 66(1), 87-99. ↩
- Hogan, A., Blomqvist, E., Cochez, M., d’Amato, C., Melo, G. D., Gutierrez, C., … & Zimmermann, A. (2021). Knowledge graphs. ACM Computing Surveys (CSUR), 54(4), 1-37. ↩


