Introduction to knowledge graphs (part 1): Definitions and applications
This article is part 1 of the Introduction to knowledge graphs series of articles.
Recent research1 has identified the development of knowledge graphs as an important aspect of artificial intelligence (AI) in knowledge management (KM), and that indeed, many businesses are already using knowledge graphs for AI-enabled KM.
The same research also recommended the training of knowledge scientists who can contribute to the process of combining the two distinct AI strategies – symbolic AI (using more traditional approaches) and statistical AI (based on neural networks) – by helping to build knowledge graphs that represent background knowledge and that complement training data.
To assist in advancing AI in KM, this series of articles provides an introduction to knowledge graphs, including information on the history of knowledge graphs, graph data models, knowledge representation and extraction, and future directions. This first article of the series defines knowledge graphs and summarises their applications.
Defining knowledge graphs
In their comprehensive multi-author tutorial article2, Aidan Hogan and colleagues advise that a number of different and sometimes conflicting definitions of knowledge graphs have emerged, varying from specific technical proposals to more inclusive general proposals.
Although the phrase “knowledge graph” appeared as early as 1972, the modern incarnation of the term stems from the 2012 announcement of the Google Knowledge Graph, followed by further announcements of knowledge graphs by other companies including Amazon, Facebook, and Microsoft. In the time since, knowledge graphs have increasingly become the focus of academic study, with a growing number of papers published on the topic. Through this research, knowledge of knowledge graphs has developed considerably, and definitions have evolved.
In their paper3 “Towards a Definition of Knowledge Graphs,” Lisa Ehrlinger and Wolfram Wöß alert to fundamental problems with knowledge graph definitions. Google’s blog entry about their Knowledge Graph is often cited as if it provides a proper explanation of knowledge graphs, but the terms knowledge graph and knowledge base are used interchangeably. This leads to the misleading assumption that the term knowledge graph is a synonym for knowledge base, which is itself often used as synonym for ontology.
In response, Ehrlinger and Wöß have developed a definition from knowledge graph architecture and a terminological analysis. Their definition is more general than technical, being:
A knowledge graph acquires and integrates information into an ontology and applies a reasoner to derive new knowledge.
However, while essentially being the same, Hogan and colleagues’ definition is more technical. They define a knowledge graph as:
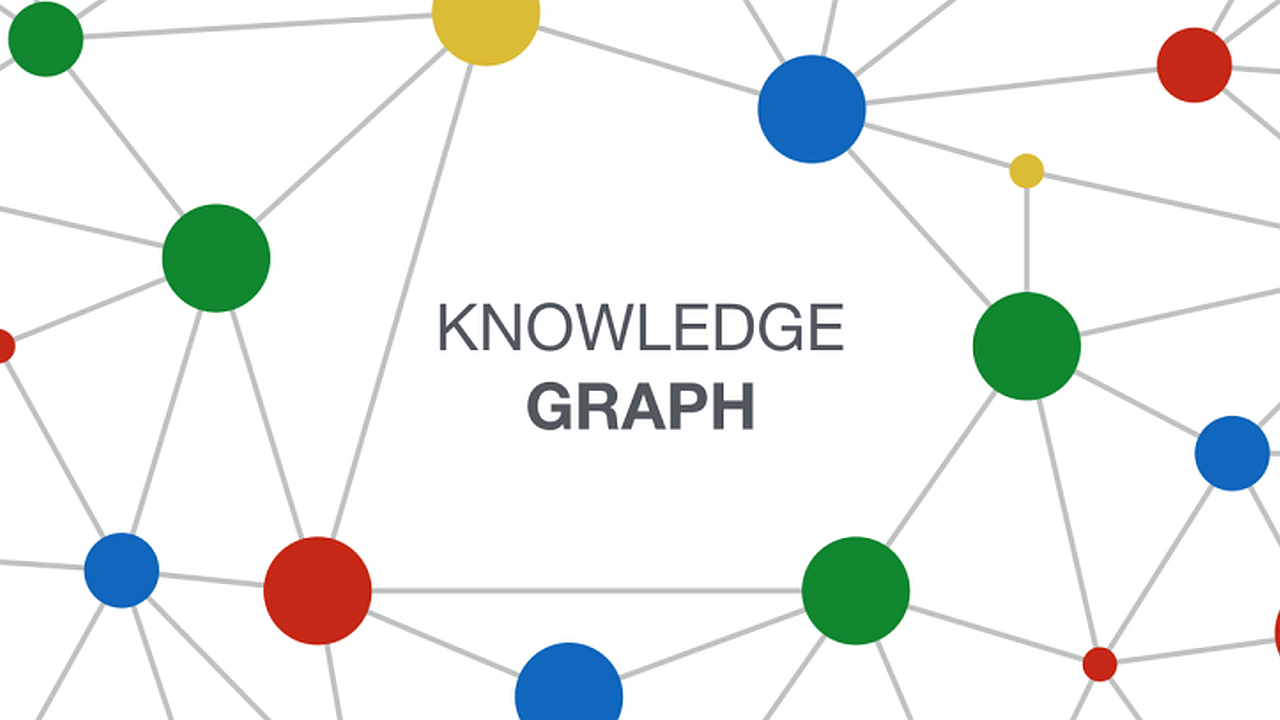
…a graph of data intended to accumulate and convey knowledge of the real world, whose nodes represent entities of interest and whose edges represent potentially different relations between these entities.
Hogan and colleagues also make the point that the “knowledge” in the term “knowledge graphs” refers to what Nonaka and Takeuchi call “explicit knowledge,” that is, something that is known and can be written down. However, as will be seen in later articles in this series, what Nonaka and Takeuchi call “tacit knowledge” – the knowledge of experience – has a role in deducing more from knowledge graph data than what the graph edges explicitly indicate.
Applications of knowledge graphs
A Stanford University educational resource4 provide an overview of the recent applications of knowledge graphs, which are summarised below.
Knowledge Graphs for organizing knowledge over the internet
An example of the use of a knowledge graph over the web is Wikidata, which acts as the central storage for the structured data for Wikipedia.
Wikidata includes data from several independent providers, for example, the Library of Congress. By using Wikidata identifiers, the information released by Library of Congress can be easily linked with information available from other sources. Wikidata makes it easy to establish such links by publishing the definitions of relationships used in it in Schema.Org. Schema.org is a collaborative, community activity with a mission to create, maintain, and promote schemas for structured data on the internet, on web pages, in email messages, and beyond.
The vocabulary of relations in Schema.Org gives at least three advantages. First, it is possible to write queries that span across multiple datasets that would not have been possible otherwise. Second, with such a query capability, it is possible to easily generate structured information boxes within Wikipedia. Third, structured information returned by queries also can appear in the search results which is now a standard feature for the leading search engines.
A recent version of Wikidata had over 80 million objects, with over one billion relationships among those objects. Wikidata makes connections across over 4872 different catalogs in 414 different languages published by independent data providers. As per a recent estimate, 31% of the websites, and over 12 million data providers publish Schema.Org annotations and are currently using the vocabulary of Schema.Org.
Several key features of the Wikidata knowledge graph can be observed. First, it is a graph of unprecedented scale, and is the largest knowledge graph available today. Second, it is being jointly created by a community of contributors. Third, some of the data in Wikidata may come from automatically extracted information, but it must be easily understood and verified as per the Wikidata editorial policies. Fourth, there is an explicit effort to provide semantic definitions of different relation names through the vocabulary in Schema.Org. Finally, the primary driving use case for Wikidata is to improve web search. Even though Wikidata has several applications using it for analytical and visualization tasks, its use over the web continues to be the most compelling and easily understood application.
Knowledge graphs for data integration in enterprises
Data integration is the process of combining data from different sources, and providing the user with a unified view of data. A large proportion of data in enterprises resides in relational databases. One approach to data integration relies on a global schema that captures the interrelationships between the data items represented across these databases. Creating a global schema is an extremely difficult process because there are many tables and attributes; the experts who created the databases are usually not available; and because of lack of documentation, it is difficult to understand the meaning of the data.
Because of the challenges in creating a global schema, it is convenient to sidestep this issue, and convert the relational data into a knowledge graph. The mappings between the attributes are created on an as needed basis, for example, in response to addressing specific business questions, and can themselves be represented within a knowledge graph.
Knowledge graphs in artificial intelligence
Knowledge graphs, in the form of semantic networks, have been used as a representation for artificial intelligence since the early days of the field. Over the years, semantic networks were evolved into different representations such as conceptual graphs, description logics, and rule languages. To capture uncertain knowledge, probabilistic graphical models were invented.
A widely known application of the representation languages that originated from semantic networks is in capturing ontologies. An ontology is formal specification of the conceptualization of a domain. An ontology plays an important role in information exchange and in capturing the background knowledge of a domain that could be used for reasoning and answering questions.
The World Wide Web Consortium (W3C) standardized a family of knowledge representation languages that are now widely used for capturing knowledge on the internet. These languages include the Resource Description Frame (RDF), Web Ontology Language (OWL), and the Semantic Web Rule Language (SWRL).
A central challenge in AI is the knowledge acquisition bottleneck, that is, how to capture knowledge into the chosen representation in an economically scalable manner. Early approaches relied on knowledge engineering. Efforts to automate portions of knowledge engineering led to techniques such as inductive learning, and the current generation of machine learning.
Therefore, it is natural that knowledge graphs are being used as a representation of choice for storing the knowledge automatically learned. There is also an increasing interest in leveraging domain knowledge that is expressed in knowledge graphs to improve machine learning.
Knowledge graphs as the output of machine learning
Knowledge graphs are being used as a target output representation for natural language processing and computer vision algorithms.
Entity extraction and relation extraction from text are two fundamental tasks in natural language processing. The extracted information from multiple portions of the text needs be correlated, and knowledge graphs provide a natural medium to accomplish such a goal.
A holy grail of computer vision is the complete understanding of an image, that is, creating a model that can name and detect objects, describe their attributes, and recognize their relationships. Understanding scenes would enable important applications such as image search, question answering, and robotic interactions. Much progress has been made in recent years towards this goal, including image classification and object detection.
Knowledge graphs as input to machine learning
Popular deep machine learning models rely on a numerical input which requires that any symbolic or discrete structures should first be converted into a numerical representation. Embeddings that transform a symbolic input into a vector of numbers have emerged as a representation of choice for input to machine learning models. Examples include word embeddings and graph embeddings.
Word embeddings were developed for calculating similarity between words. Techniques exist for automatically learning word embeddings for any given text. Use of word embeddings has been found to improve the performance of many natural language processing tasks including entity extraction, relation extraction, parsing, passage retrieval, etc. One of the most common applications of word embeddings is in auto completion of search queries. Word embeddings give us a straightforward way to predict the words that are likely to follow the partial query that a user has already typed.
As a text is a sequence of words, and word embeddings calculate co-occurrences of words in it, we can view the text as a knowledge graph in which every word is a node, and there is a directed edge between each word and another word that immediately follows it. Graph embeddings generalize this notion for general network structure. The goal and approach, however, remains the same: represent each node in a knowledge graph by a vector, so that the similarity between the nodes can be calculated as a difference between their corresponding vectors. The vectors for each node are also referred to as graph embeddings.
Graph embeddings are a generalization of the word embeddings. They are a way to input domain knowledge expressed in a knowledge graph into a machine learning algorithm. Graph embeddings do not induce a knowledge representation, but are a way to turn symbolic representation into a numeric representation for consumption by a machine learning algorithm.
Once knowledge graph embeddings have been calculated, they can be used for a variety of applications. For example, one obvious use for the knowledge graph embeddings calculated from a friendship graph is to recommend new friends. A more advanced task involves link prediction (that is, the likelihood of a link between two nodes). Link prediction in a company graph could be used to identify potential new customers.
Next part: (part 2): History of knowledge graphs.
Header image source: Crow Intelligence, CC BY-NC-SA 4.0.
References:
- Jarrahi, M. H., Askay, D., Eshraghi, A., & Smith, P. (2023). Artificial intelligence and knowledge management: A partnership between human and AI. Business Horizons, 66(1), 87-99. ↩
- Hogan, A., Blomqvist, E., Cochez, M., d’Amato, C., Melo, G. D., Gutierrez, C., … & Zimmermann, A. (2021). Knowledge graphs. ACM Computing Surveys (CSUR), 54(4), 1-37. ↩
- Ehrlinger, L., & Wöß, W. (2016). Towards a definition of knowledge graphs. SEMANTiCS (Posters, Demos, SuCCESS), 48(1-4), 2. ↩
- Stanford University. (n.d.). Knowledge Graphs. What is a Knowledge Graph? ↩


