Introduction to knowledge graphs (section 3.3): Data graphs – Validation
This article is section 3.3 of part 3 of the Introduction to knowledge graphs series of articles. Recent research has identified the development of knowledge graphs as an important aspect of artificial intelligence (AI) in knowledge management (KM).
While graphs offer a flexible representation for diverse, incomplete data at large-scale, we may wish to validate that our data graph follows a particular structure or is in some sense “complete.” In Figure 1, for example, we may wish to ensure that all events have at least a name, venue, start and end date, such that applications using the data – e.g., one notifying users of events – have the minimal information required.
Drawing on Hogan and colleagues’ comprehensive tutorial article1, this third section of the data graphs part of the series describes one mechanism to facilitate such validation – shapes graphs.
Shapes Graphs
A shape targets a set of nodes in a data graph and specifies constraints on those nodes. The shape’s target can be specified manually, using a query, and so on. A shapes graph is then formed from a set of interrelated shapes. Figure 8 illustrates an example of a shapes graph based on Figure 1, defining constraints on four interrelated shapes. Each shape – denoted with a box such as “Place” , “Event”, and so on – is associated with a set of constraints. Nodes conform to a shape if and only if they satisfy all constraints defined on the shape.
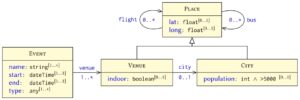
Another option is to place constraints on the number of nodes conforming to a particular shape that the conforming node can relate to with an edge-label. For example,
![]()
denotes that conforming nodes for “Event” must link to at least one node that conforms to the “Venue”
shape with the edge label venue.
Boolean combinations of shapes can be defined using conjunction (and), disjunction (or), and negation (not); for example, we may say that all the values of venue should conform to the shape
![]()
making explicit that venues in the data should not be directly given as cities.
When declaring shapes, the data modeller may not know in advance the entire set of properties that some nodes can have. An open shape allows the node to have additional properties not specified by the shape, while a closed shape does not. For example, if we add the edge
![]()
to the graph represented in Figure 1, then “Santiago” only conforms to the “City” shape if that shape is defined as open (since the shape does not mention founder).
Conformance
A node conforms to a shape if it satisfies all of the constraints of the shape. The conformance of a node to a shape may depend on the conformance of other nodes to other shapes; for example, the node “EID15” conforms to the “Event” shape not only based on its local properties, but also based on conformance of “Santa Lucía” to “Venue” and “Santiago” to “City.”
Conformance dependencies may also be recursive, where the conformance of “Santiago” to “City” requires that it conform to “Place,” which requires that “Viña del Mar” and “Arica” conform to “Place,” and so on. Conversely, “EID16” does not conform to “Event,” as it does not have the start and end properties required by the shapes graph.
A graph is valid with respect to a shapes graph (and its targets) if and only if every node that each shape targets conforms to that shape; for example, if “Event” targets “EID15” and “EID16,” then the graph of Figure 1 will not be valid with respect to the shapes graph of Figure 8 (“EID16” does not conform to “Event”), whereas if “Event” targets “EID15” only, and no other target is defined, then the graph is valid.
Other Features
Two shapes languages with such features have been proposed for RDF graphs: ShEx (Shape Expressions) and SHACL (Shapes Constraint Language). These languages also support additional features; for example, SHACL supports constraints expressed using graph queries in the SPARQL language. Similar ideas have been proposed for property graphs.
Next part: (section 3.4): Data graphs – Context.
Header image source: Crow Intelligence, CC BY-NC-SA 4.0.
References:
- Hogan, A., Blomqvist, E., Cochez, M., d’Amato, C., Melo, G. D., Gutierrez, C., … & Zimmermann, A. (2021). Knowledge graphs. ACM Computing Surveys (CSUR), 54(4), 1-37. ↩