Introduction to knowledge graphs (section 3.1): Data graphs – Models
This article is section 3.1 of part 3 of the Introduction to knowledge graphs series of articles. Recent research has identified the development of knowledge graphs as an important aspect of artificial intelligence (AI) in knowledge management (KM).
Graphs offer a flexible way to conceptualise, represent, and integrate diverse and incomplete data. Drawing on Hogan and colleagues’ comprehensive tutorial article1, this first section of the data graphs part of the series summarises the graph data models most commonly used in practice.
Directed Edge-labelled Graphs
A directed edge-labelled graph, or del graph for short (also known as a multi-relational graph) is defined as a set of nodes – such as:![]() and a set of directed labelled edges between those nodes, such as:
and a set of directed labelled edges between those nodes, such as:
![]()
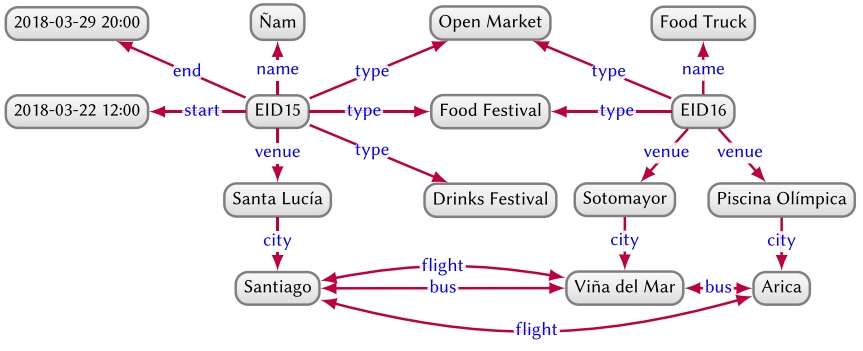
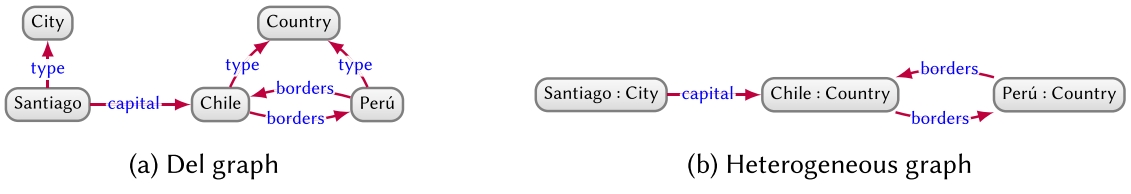
In knowledge graphs, nodes represent entities (the city Santiago; the hill Santa Lucía; noon on March 22nd, 2018; etc.) and edges represent binary relations between those entities (e.g., Santa Lucía is in the city Santiago). Figure 1 exemplifies how the tourism board could model event data as a del graph. Adding data to such a graph typically involves adding new nodes and edges. Representing incomplete information requires simply omitting a particular edge (e.g., the graph does not yet define a start/end date-time for the Food Truck festival). A standard data model based on del graphs is the Resource Description Framework (RDF).
Heterogeneous Graphs
A heterogeneous graph (or heterogeneous information network) is a graph where each node and edge is assigned one type. Heterogeneous graphs are thus akin to del graphs – with edge labels corresponding to edge types – but where the type of node forms part of the graph model itself, rather than being expressed as a special relation, as seen in Figure 2. An edge is called homogeneous if it is between two nodes of the same type (e.g., borders); otherwise it is called heterogeneous (e.g., capital).
Heterogeneous graphs allow for partitioning nodes according to their type, for example, for the purposes of machine learning tasks. However, unlike del graphs, they typically assume a one-to-one relation between nodes and types (notice the node “Santiago” with zero types and “EID15” with multiple types in the del graph of Figure 1).
Property Graphs
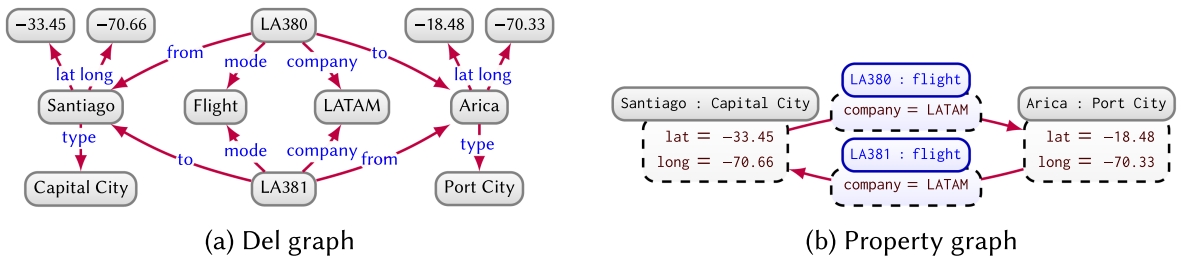
A property graph allows a set of property–value pairs and a label to be associated with nodes and edges, offering additional flexibility when modelling data. Consider, for example, modelling the airline companies that offer flights. In a del graph, we cannot directly annotate an edge like
![]()
with the company, but we could add a new node denoting a flight and connect it with the source, destination, companies, and mode, as shown in Figure 3(a). Applying this pattern to a large graph may require significant changes. Conversely, Figure 3(b) exemplifies a property graph with analogous data, where property–value pairs on edges model companies, property–value pairs on nodes indicate latitudes and longitudes, and node/edge labels indicate the type of node/edge. Though not yet standardised, property graphs are used in popular graph databases, such as Neo4j.
While the more intricate models offers greater flexibility in terms of how to encode data as a property graph (e.g., using property graphs, we can continue modelling flights as edges in Figure 3(b)) potentially leading to a more intuitive representation, these additional details likewise require more intricate query languages, formal semantics, and inductive techniques versus simpler graph models such as del graphs or heterogeneous graphs.
Graph Dataset
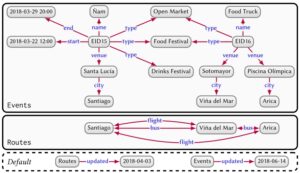
A graph dataset allows for managing several graphs and consists of a set of named graphs and a default graph. Each named graph is a pair of a graph ID and a graph. The default graph is a graph without an ID and is referenced “by default” if a graph ID is not specified. Figure 4 provides an example where events and routes are stored in two named graphs, and the default graph manages meta-data about the named graphs.
Though the example uses del graphs, graph datasets can be generalised to other types of graphs. Graph datasets are useful for managing and querying data from multiple sources, where each source can be managed as a separate graph, allowing individual graphs to be queried, updated, removed, and so on, as needed.
Other Graph Data Models
The graph models presented thus far are the most popular in practice. Other graph data models exist with nodes that may contain individual edges or even nested graphs (a.k.a. hypernodes). Likewise, hypergraphs allow edges that connect sets rather than pairs of nodes. Nonetheless, data can typically be converted from one model to another; in the view of Hogan and colleagues, a knowledge graph can thus adopt any such graph data model. They discuss del graphs given their relative succinctness, but most discussion extends naturally to other models.
Graph Stores
A variety of techniques have been proposed for storing and indexing graphs, facilitating the efficient evaluation of queries (as will be discussed in the next section). Directed-edge labelled graphs can be stored in relational databases either as a single relation of arity three (triple table), as a binary relation for each property (vertical partitioning), or as n-ary relations for entities of a given type (property tables).
Custom storage techniques have also been developed for a variety of graph models, providing efficient access for finding nodes, edges, and their adjacent elements. A number of systems further allow for distributing graphs over multiple machines based on popular NoSQL stores or custom partitioning schemes.
Creation
We have seen how knowledge graphs can be modelled and stored, but how are they created? Creation often involves integrating data from diverse sources, including direct human input; extraction from existing text, markup, legacy file formats, relational databases, other knowledge graphs; and so on.
Next part: (section 3.2): Data graphs – Querying.
Header image source: Crow Intelligence, CC BY-NC-SA 4.0.
References:
- Hogan, A., Blomqvist, E., Cochez, M., d’Amato, C., Melo, G. D., Gutierrez, C., … & Zimmermann, A. (2021). Knowledge graphs. ACM Computing Surveys (CSUR), 54(4), 1-37. ↩