Introduction to knowledge graphs (section 5.1): Inductive knowledge – Graph analytics
This article is section 5.1 of part 5 of the Introduction to knowledge graphs series of articles. Recent research has identified the development of knowledge graphs as an important aspect of artificial intelligence (AI) in knowledge management (KM).
Graph analytics is the application of analytical algorithms to (often large) graphs. Such algorithms often analyse the topology of the graph, i.e., how nodes and groups thereof are connected. In this section of their comprehensive tutorial article1, Hogan and colleagues provide a brief overview of some popular graph algorithms applicable to knowledge graphs and then discuss graph processing frameworks on which such algorithms can be implemented.
Graph Algorithms
A wide variety of graph algorithms can be applied for analytical purposes. Hogan and colleagues briefly introduce five categories of algorithms that are often used in practice.
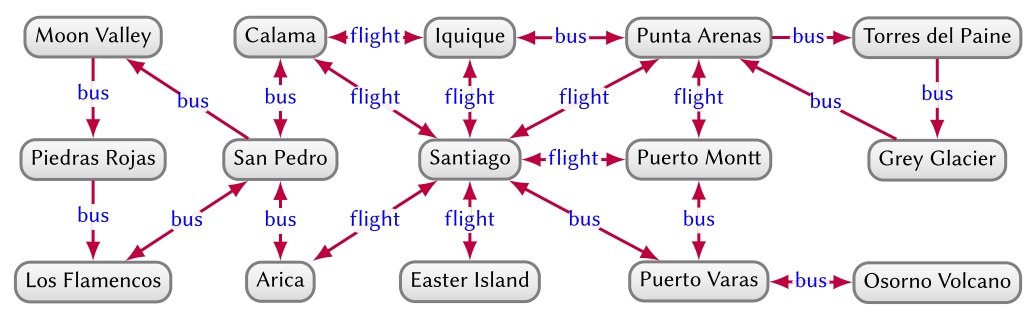
First, centrality analysis aims to identify the most important (“central”) nodes or edges of a graph. Specific node centrality measures include degree, betweenness, closeness, Eigenvector, PageRank, HITS, Katz, among others. Betweenness centrality can also be applied to edges. A node centrality measure would allow, e.g., to predict the busiest transport hubs in Figure 15, while edge centrality would allow us to find the edges on which many shortest routes depend for predicting traffic.
Second, community detection aims to identify sub-graphs that are more densely connected internally than to the rest of the graph (a.k.a. communities). Community detection algorithms include minimum-cut algorithms, label propagation, Louvain modularity, and so on. Community detection applied to Figure 15 may, for example, detect a community to the left (referring to the north of Chile), to the right (referring to the south of Chile), and perhaps also the centre (referring to cities with airports).
Third, connectivity analysis aims to estimate how well-connected and resilient the graph is. Specific techniques include measuring graph density or k-connectivity, detecting strongly connected components and weakly connected components, computing spanning trees or minimum cuts, and so on. In the context of Figure 15, such analysis may tell us that routes to ![]() and
and ![]() are the most “brittle,” becoming disconnected from the main hubs if one of two bus routes fail.
are the most “brittle,” becoming disconnected from the main hubs if one of two bus routes fail.
Fourth, node similarity aims to find nodes that are similar to other nodes by virtue of how they are connected within their neighbourhood. Node similarity metrics may be computed using structural equivalence, random walks, diffusion kernels, and so on. These methods provide an understanding of what connects nodes and in what ways they are similar. In Figure 15, such analysis may tell us that ![]() and
and ![]() are similar nodes, as both have return flights to
are similar nodes, as both have return flights to ![]() and return buses to
and return buses to ![]()
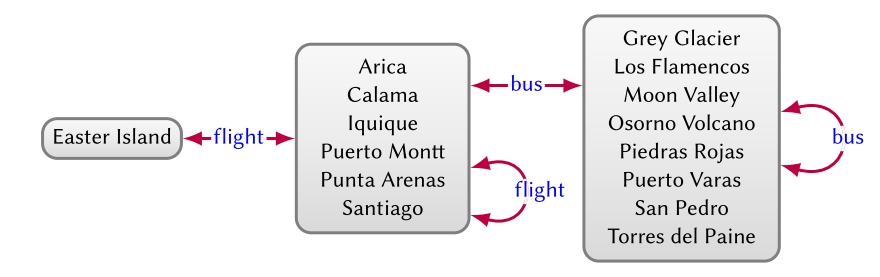
Fifth, graph summarisation aims to extract high-level structures from a graph, often based on quotient graphs, where nodes in the input graph are merged while preserving the edges between the input nodes. Such methods help to provide an overview for a large-scale graph. Figure 16 provides an example of a quotient graph that summarises the graph of Figure 15, such that if there is an edge ![]() in the input graph, then there is an edge
in the input graph, then there is an edge ![]() in the quotient graph with s ∈ S and o ∈ O. In this case, quotient nodes are defined in terms of outgoing edge-labels, where we may detect that they represent islands, cities, and towns/attractions, respectively, from left to right.
in the quotient graph with s ∈ S and o ∈ O. In this case, quotient nodes are defined in terms of outgoing edge-labels, where we may detect that they represent islands, cities, and towns/attractions, respectively, from left to right.
Many such techniques have been proposed and studied for simple graphs or directed graphs without edge labels. An open research challenge in the context of knowledge graphs is to adapt such algorithms for graph models such as del graphs, heterogeneous graphs and property graphs.
Graph Processing Frameworks
Various graph parallel frameworks have been proposed for large-scale graph processing, including Apache Spark (GraphX), GraphLab2, Pregel3, Signal/Collect, Shark4, and so on. Computation in these frameworks is iterative, where in each iteration, each node reads messages received through inward edges (and possibly its own previous state), performs a computation, and then sends messages through outward edges using the result.
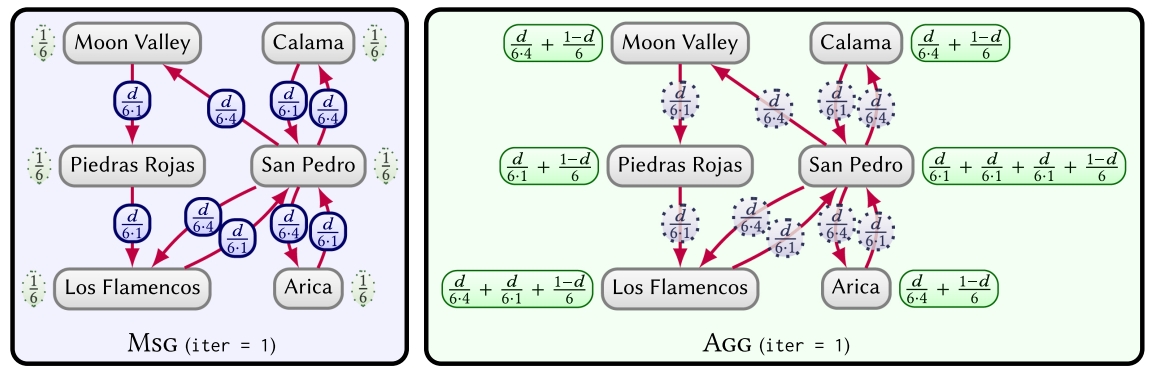
To illustrate, assume we wish to compute the places that are most (or least) easily reached in the graph of Figure 15. A good way to measure this is using centrality, where we choose PageRank5, which computes the probability of a tourist that randomly follows the routes shown in the graph being at a particular place after a given number of “hops.” We can implement PageRank on large graphs using a graph parallel framework. In Figure 17, we provide an example of an iteration of PageRank for a sub-graph of Figure 15. The nodes are initialised with a score of ![]() A tourist is assumed to have an equal chance of starting at any point. In the message phase (MSG), each node v passes a score of
A tourist is assumed to have an equal chance of starting at any point. In the message phase (MSG), each node v passes a score of ![]() on each of its outgoing edges, where we denote by d a “damping factor” (typically d = 0.85) used to ensure convergence, by Ri(v) the score of node v in iteration i (the probability of the tourist being at node v after i hops), and by |E(v)| the number of outgoing edges of v. The aggregation phase (AGG) for v then sums all incoming messages along with its share of the damping factor
on each of its outgoing edges, where we denote by d a “damping factor” (typically d = 0.85) used to ensure convergence, by Ri(v) the score of node v in iteration i (the probability of the tourist being at node v after i hops), and by |E(v)| the number of outgoing edges of v. The aggregation phase (AGG) for v then sums all incoming messages along with its share of the damping factor ![]() to compute
to compute ![]() We then proceed to the message phase of the next iteration, continuing until some termination criterion is reached and results are output.
We then proceed to the message phase of the next iteration, continuing until some termination criterion is reached and results are output.
While the given example is for PageRank, this abstraction is general enough to support a wide variety of (though not all) graph algorithms. An algorithm in this framework consists of the functions to compute message values (Msg) and to accumulate messages (Agg). The framework will then take care of distribution, message passing, fault tolerance, and so on.
Next part: (section 5.2): Inductive knowledge – Knowledge graph embeddings.
Header image source: Crow Intelligence, CC BY-NC-SA 4.0.
References:
- Hogan, A., Blomqvist, E., Cochez, M., d’Amato, C., Melo, G. D., Gutierrez, C., … & Zimmermann, A. (2021). Knowledge graphs. ACM Computing Surveys (CSUR), 54(4), 1-37. ↩
- Wikipedia, CC BY-SA 4.0. ↩
- Malewicz, G., Austern, M. H., Bik, A. J., Dehnert, J. C., Horn, I., Leiser, N., & Czajkowski, G. (2010, June). Pregel: a system for large-scale graph processing. In Proceedings of the 2010 ACM SIGMOD International Conference on Management of data (pp. 135-146). ↩
- Xin, R. S., Rosen, J., Zaharia, M., Franklin, M. J., Shenker, S., & Stoica, I. (2013, June). Shark: SQL and rich analytics at scale. In Proceedings of the 2013 ACM SIGMOD International Conference on Management of data (pp. 13-24). ↩
- Page, L., Brin, S., Motwani, R., & Winograd, T. (1999). The PageRank citation ranking: Bringing order to the web. Stanford Infolab. ↩