
A picture is worth a 1000 words [Knowledge visualization series part 1]
This article by Hanlie Smuts is part 1 of a series of articles exploring knowledge visualization aspects from an organizational perspective.
The world is seeing revolutionary advances in science and technology – labelled Industry 4.0 by some. With this evolution of digital technologies, many opportunities realize through the application of the digital technologies such as cyber-physical systems where control and monitoring are done by computer-based algorithms e.g. autonomous vehicles, the internet of things creating a connected world e.g. enabling smart cities, cloud computing providing on-demand availability of data storage and computing power and cognitive computing e.g. artificial intelligence. Both from an organizational commercial perspective, as well as a knowledge and skill outlook, digital technologies enable two options: firstly, they provide multiple options for an organization to embrace digital transformation and secondly, they enable a world of visual and experiential learning in order to enhance skills and knowledge.
Knowledge visualization refers to the application of visual representation techniques from multiple visualization domains aiding knowledge-intense processes among employees in an organization (e.g. knowledge creation, knowledge sharing). The aim of using these visual representations, is to transfer insights, to develop new knowledge and to deliver a richer approach to communicating what employees know.
Whether an organization addresses smart offerings for customers or fostering innovation through sharing organizational knowledge, the transfer and creation of knowledge may be achieved more effectively through knowledge visualization. Big data and large volumes of institutional data, information and knowledge, support knowledge visualization efficacy as employees not only has to deal with these large volumes, but also have to understand the context and linkages in the corpus. As a first step, we therefore considered key aspects for the application of knowledge visualization as an organizational knowledge sharing tool.
They are:
- Purpose: the reason why the knowledge visualization is done or created. It talks to the required scope within the organizational body of knowledge that must be visualized with the aim to achieve transferring and sharing knowledge, as well as communicating ideas and insights.
- Design principles: depicts the key considerations when designing the knowledge visualization aligned to the purpose and aims to establish a good design that is simple to understand, cohesive and explanatory in nature. Employees must be able to easily associate the knowledge visualization with the organizational purpose and the objective of what needs to be achieved with the knowledge transfer.
- Design elements: typical elements that relates to the interface with employees and in particular the usability of the knowledge visualization interface.
- Target audience: includes knowledge visualization elements related to the target audience in the organization.
These elements were collated as part of a detailed study1 where 15 knowledge visualization elements were identified, and allocated across the key aspects as shown in the figure below.
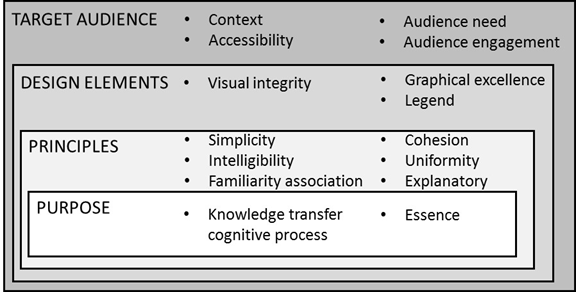
The key aspects are shown as an embedded and layered framework to denote the interdependency among the key aspects. Purpose at the core, impacts greatly on the focus of the knowledge visualization and each layer contribute further to guide or clarify what is required for the organization.
In subsequent posts, I will describe each of the key aspects as it relates to knowledge visualization in an organizational context, in detail:
Part 2: Purpose, at the core of knowledge visualization
Part 3: Principles, framing the knowledge visualization
Part 4: Design elements towards knowledge visualization efficacy
Part 5: Knowledge visualization, it is about the context
Part 6: The proof is in the pudding – knowledge visualization types and examples.
Next part (part 2): Purpose, at the core of knowledge visualization.
Header image source: Gerd Altmann on Pixabay, Public Domain.
Reference:
- Smuts H., & Scholtz II. (2020). A Conceptual Knowledge Visualisation Framework for Transfer of Knowledge: An Organisational Context. In: Hattingh M., Matthee M., Smuts H., Pappas I., Dwivedi Y.K., Mäntymäki M. (eds) Responsible Design, Implementation and Use of Information and Communication Technology. I3E 2020. Lecture Notes in Computer Science, vol 12067. Springer, Cham. DOI: 10.1007/978-3-030-45002-1_24 ↩


Proud to be a student of such professor, nice article
Thank you so much Sam!