Seven methods for mapping systems
By Pete Barbrook-Johnson and Alexandra S. Penn. Originally published on the Integration and Implementation Insights blog.
What are some effective approaches for developing causal maps of systems in participatory ways? How do different approaches relate to each other and what are the ways in which systems maps can be useful?
Here we focus on seven system mapping methods, described briefly in alphabetical order.
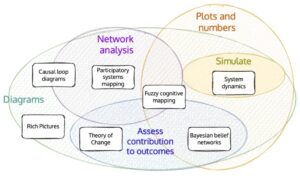
1. Bayesian Belief Networks: a network of variables representing their conditional dependencies (ie., the likelihood of the variable taking different states depending on the states of the variables that influence them). The networks follow a strict acyclic structure (ie., no feedbacks), and nodes tend to be restricted to maximum two incoming arrows. These maps are analysed using the conditional probabilities to compute the potential impact of changes to certain variables, or the influence of certain variables given an observed outcome.
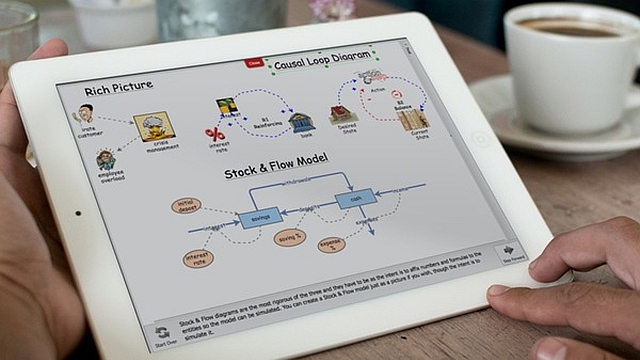
2. Causal Loop Diagrams: networks of variables and causal influences, which normally focus on feedback loops of different lengths and are built around a ‘core system engine’. Maps vary in their complexity and size and are not typically exposed to any formal analysis, but are often the first stage in a system dynamics model.
3. Fuzzy Cognitive Mapping: networks of factors and their causal connections. They are especially suited to participatory contexts, and often multiple versions are created to capture diverse mental models of a system. Described as ‘semi-quantitative’, factors and connections are usually given values, and the impacts of changes in a factor value on the rest of the map are computed in different ways.
4. Participatory Systems Mapping: a network of factors and their causal connections, annotated with salient information from stakeholders (eg., what is important, what might change). Maps tend to be large and complex. They are analysed using network analysis and information from stakeholders to extract noteworthy submaps and narratives.
5. Rich Pictures: a free-form drawing approach in which participants are asked to draw the situation or system under consideration as they wish, with no or only a handful of gentle prompts. This method is part of the wider group of soft systems methodologies.
6. System Dynamics: a network of stocks (numeric values for key variables) and flows (changes in a stock usually represented by a differential equation), and the factors that influence these. Normally, these maps are fully specified quantitatively and used to simulate future dynamics.
7. Theory of Change Maps: networks of concepts usually following a flow from inputs, activities, outputs, and outcomes to final impacts. Maps vary in their complexity and how narrowly they focus on one intervention and its logic, but they are always built around some intervention or action. Maps are often annotated and focused on unearthing assumptions in the impact of interventions.
How do these methods relate to each other?
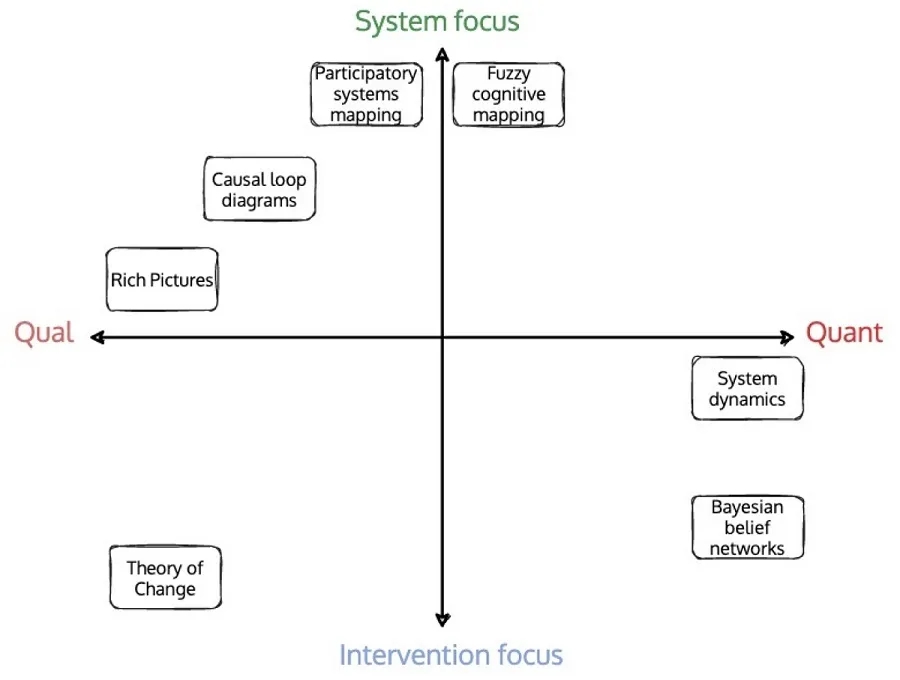
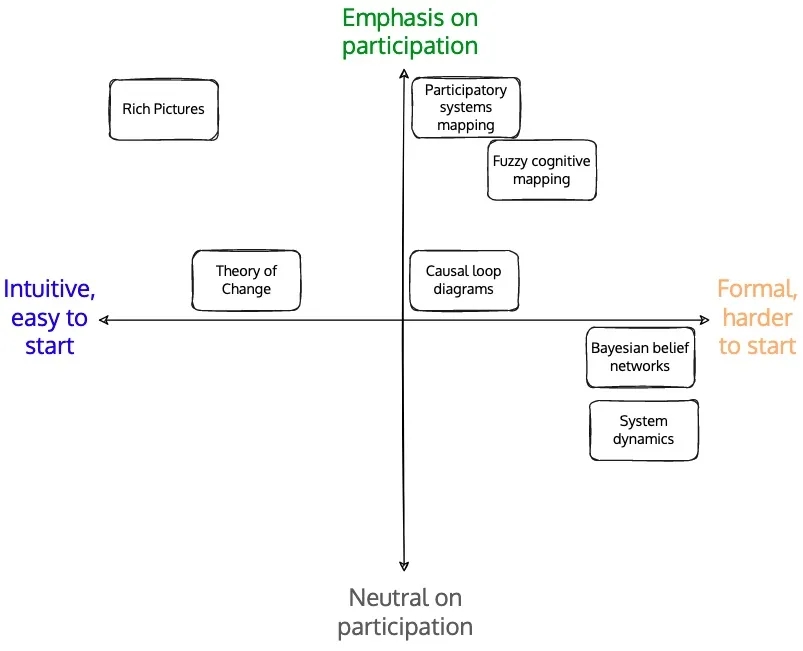
The following three figures show how these methods relate to each other. While individual projects could use any of these methods in a different way, these figures give a rough sense of where these methods sit in relation to one another, and what some of the most important axes on which to differentiate them are.
The first figure looks at the overall focus and nature of the different system mapping methods.
The second figure focuses on the mode and ease of use of the different system mapping methods.
The third figure presents the outputs and analysis the different system mapping methods produce.
How can systems mapping be useful?
We next suggest five broad types of use, which also apply to most types of modelling or analysis.
1. Helping us think: system maps of all types force us to be more specific about our assumptions, beliefs, and understanding of a system. Many types of systems mapping also force us to structure our ideas using some set of rules or symbols (ie., creating boxes and lines to represent concepts and their relationships). This will introduce simplifications and abstractions, but it will also make explicit our mental models.
2. Helping us orient ourselves: a systems mapping process will often also help us orient ourselves to a system or issue. Whether a map helps us see our, and others’, positions in the system, or whether it helps us quickly develop a fuller understanding of an issue, we will be better oriented to it. This helps people navigate the system better, be aware of what else to think about when considering one part of a map, or know who is affected and so should be included in discussions.
3. Helping us synthesise and connect information: the more flexible types of mapping are particularly good at bringing together different types of data, evidence, and information. They can all be used to inform the development of a map, making connections that would not otherwise be possible. Different types of visualisation, hyperlinking, and map structure can also be used to help people return to the information underlying a map.
4. Helping us communicate: whether we build maps in groups, or alone, and then share them, all system maps should help us communicate our mental models and representations of systems. The process of mapping with others, and the discussions it generates, unearths a multitude of assumptions which can then also be challenged and unpicked. The end product of a mapping process can also help us communicate our ideas about a system. Maps can become repositories for our knowledge which can be accessed by others, and updated, becoming a living document.
5. Helping us extrapolate from assumptions to implications: systems mapping approaches which can be turned into simulations, or which can be analysed in a formal way, also allow us to follow through from the assumptions we have embedded in them, to their implications.
Concluding questions
Are there other methods that you use to develop causal maps of systems and that can be used in participatory ways? What’s the main value that you have found in systems mapping? Do you have other lessons to share from your experience of systems mapping?
To find out more:
Barbrook-Johnson, P. and Penn, A. S. (2022). Systems Mapping: How to build and use causal models of systems. Palgrave-Macmillan: Cham, Switzerland. (Online – open access): https://link.springer.com/book/10.1007/978-3-031-01919-7
Biographies:
 |
1. Pete Barbrook-Johnson PhD is a social scientist and complexity scientist working on a range of environmental and energy policy topics, using systems mapping, agent-based modelling, and other related approaches. He is a Departmental Research Lecturer at the University of Oxford in the UK and a member of the Centre for the Evaluation of Complexity Across the Nexus (CECAN) hosted by the University of Surrey in Guildford, UK. |
 |
2. Alexandra S. Penn DPhil is a complexity scientist working on combining participatory methodologies and mathematical models to create tools for stakeholders to understand and ‘steer’ their complex human ecosystems. She is a Senior Research Fellow at the University of Surrey and a member of the Centre for the Evaluation of Complexity Across the Nexus (CECAN) hosted by the University of Surrey in Guildford, UK. |
Article source: Seven methods for mapping systems. Republished by permission.
Header image source: Pete Barbrook-Johnson, Smith School of Enterprise and the Environment, University of Oxford.