Using bibliometric analysis, network analysis, and visualization to evaluate KM as an academic discipline
In a recent RealKM Magazine article, I featured a study1 that author Kristijan Breznik contended was the first application of bibliometric analysis, network analysis, and visualization to understand aspects of knowledge management as an academic discipline. Breznik is a professor at the International School for Social and Business Studies in Slovenia.
The study had two purposes: investigating the development of knowledge management as an academic discipline, and analysing the linkage between knowledge management and innovation.
Breznik’s team first collected keywords through a Web of Science search. A network analysis was then conducted using the bibliometric network analysis tool CitNetExplorer and social network analysis tool Pajek. Network analysis is in general concerned with actors and the relations between them, however in this case the actors in the network are the keywords. After the network analysis, VOSviewer was then used to create co-occurrence network maps of the keywords.
The results of the analysis revealed a strong linkage between knowledge management and innovation, as shown in Figure 1.

Breznik concluded his study with the advice that the “network analytic procedures used in this paper offer an excellent tool for analyzing such an important topic.” Consistent with this advice, another new paper2 has applied these analytic procedures to ask a wider range of questions in regard to KM as an academic discipline. The paper authors are Peng Wang, Fang-Wei Zhu, Hao-Yang Song, Jian-Hua Hou, and Jin-Lan Zhang from Dalian University of Technology and Dalian University in China.
I’ve already featured one of the visualizations from the Wang et al. study in last week’s article discussing the world’s very unequal knowledge management research map.
As well as being an important study in regard to the application of bibliometric analysis, network analysis, and visualization to KM as an academic discipline, this new paper has been published as not only open access research, but also under a Creative Commons license. The authors are commended for practicing what the KM discipline preaches in regard to knowledge sharing, something I’ve argued that more researchers need to do.
The importance of bibliometric analysis
Wang et al. advise that bibliometric analyses are to an academic field what systematic reviews are to research literature.
As I’ve previously advised, systematic reviews3 are a fundamental aspect of evidence-based KM. A systematic review brings together the findings of a range of studies to answer a particular research question, facilitating the identification of strengths and weaknesses in the literature, evidence research gaps, and appropriate questions for future research. Systematic reviews can be of either qualitative or quantitative research findings, or a mixed-method4 integration of both.
Bibliometric analysis can be defined as a statistical method of determining the quantitative features of bibliographic information, literature, articles, and journals. Just as systematic reviews provide a reliable knowledge base for evidence-based practice, bibliometric analyses provide a vital knowledge base for evidence-based decisions in regard to research priorities. A Thomson Reuters white paper on bibliometrics advises that5 “Bibliometrics (sometimes called Scientometrics) turns the main tool of science, quantitative analysis, on itself.” The white paper further alerts that:
Those in universities, government offices and labs, and boardrooms must decide what research should be supported and what should not, or which research projects and researchers should receive more support than others … A library faced with collection decisions, a foundation making funding choices, or a government office weighing national research needs must rely on expert analysis of scientific research performance.
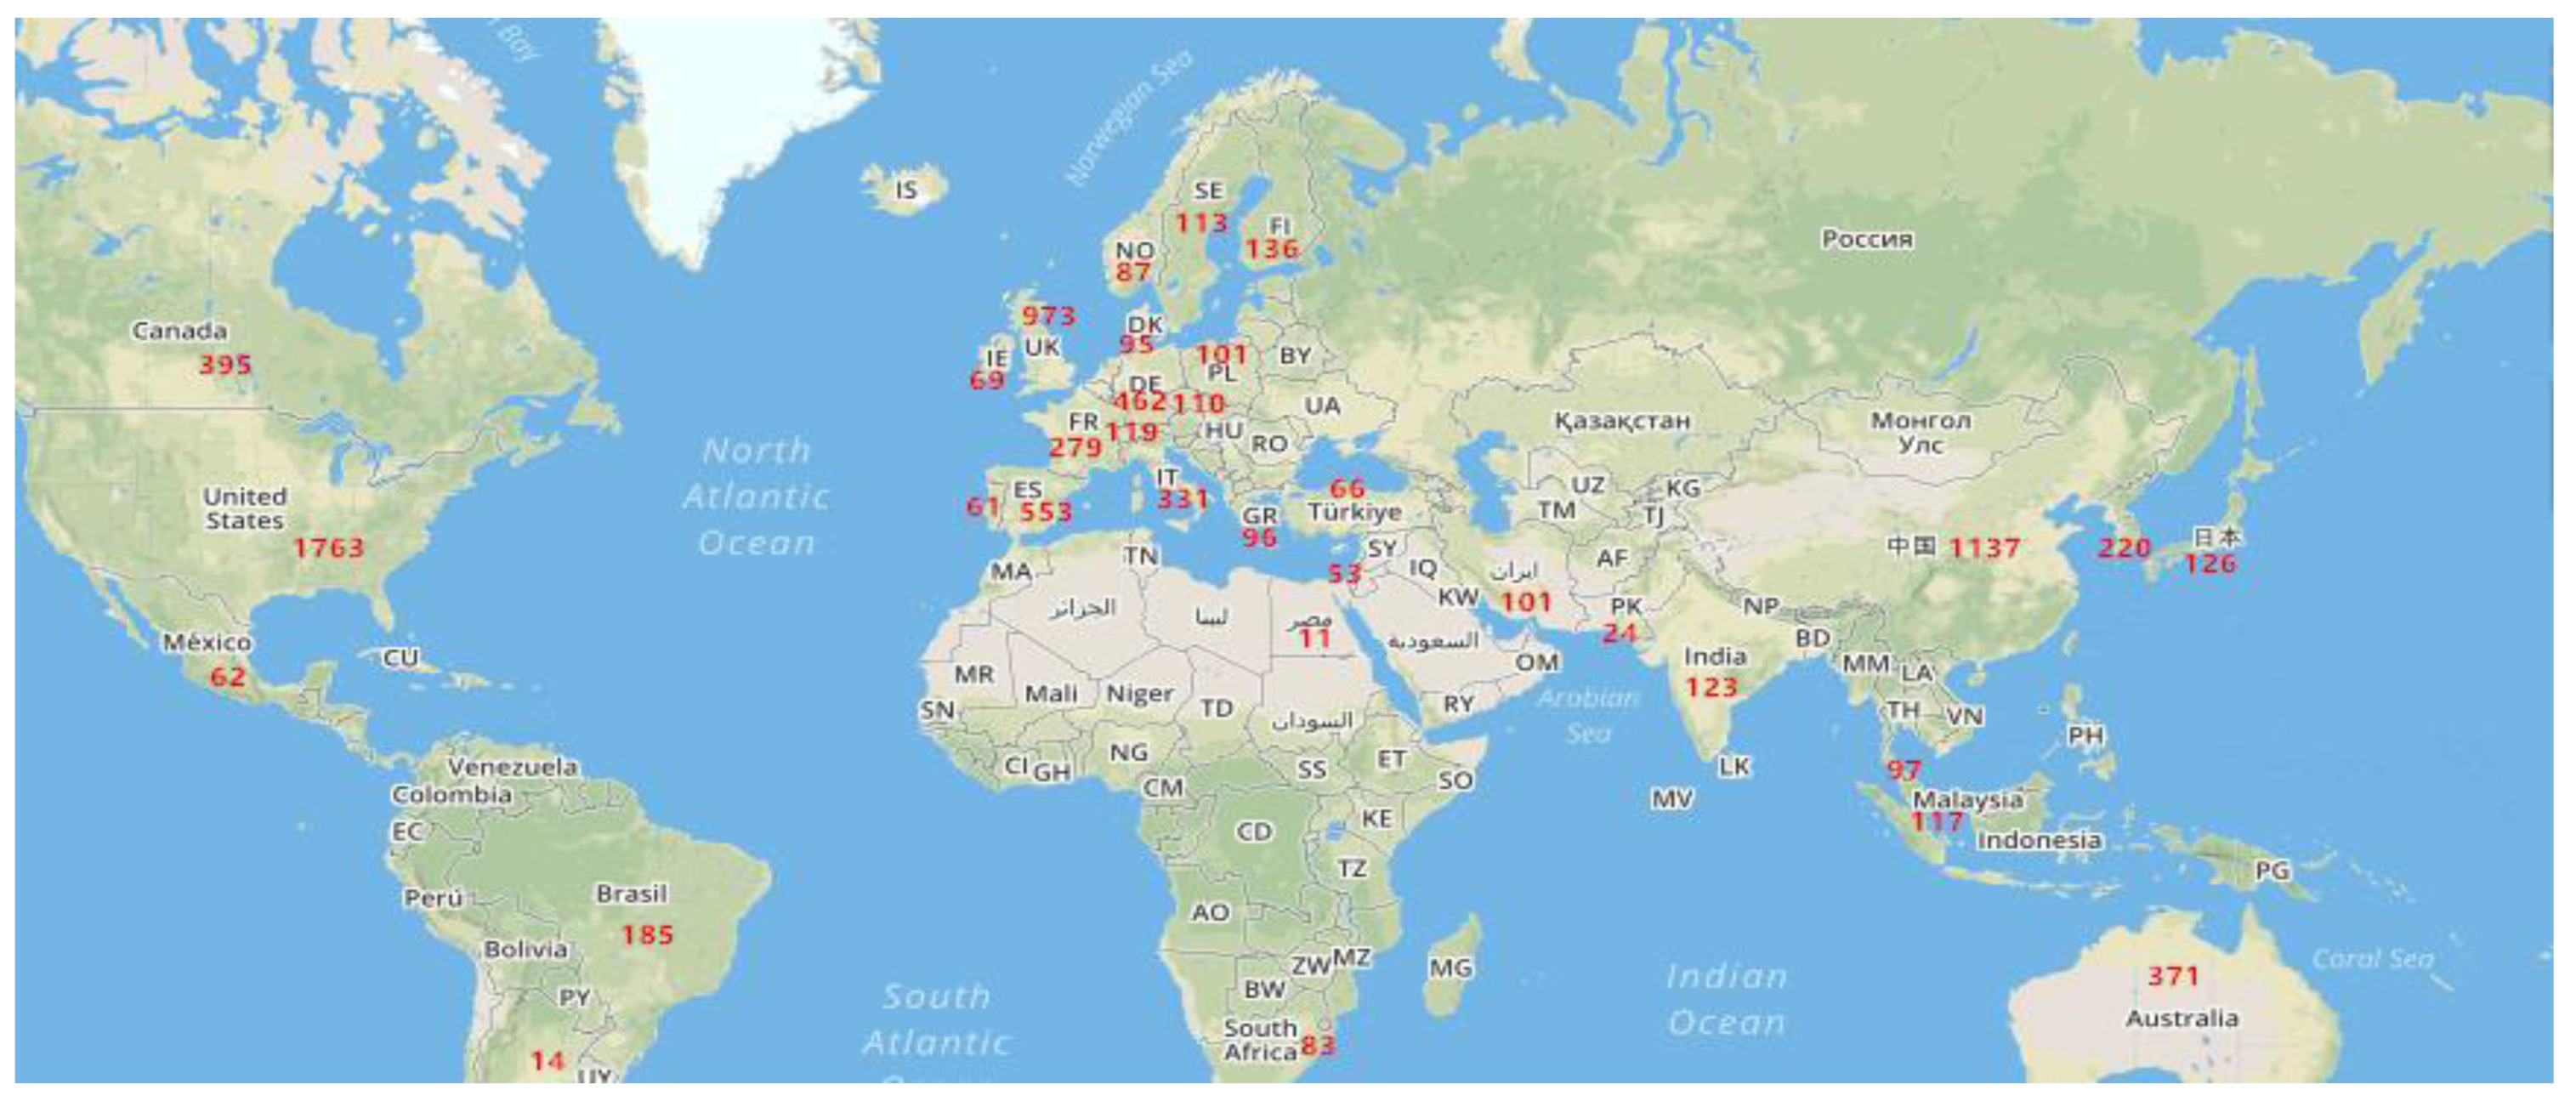
This is clearly demonstrated in last week’s article discussing the world’s very unequal KM research map, with one of the visualizations from the Wang et al. study starkly illustrating the serious global North / global South inequality in regard to KM research (see Figure 4 below).
Applying bibliometric analysis, network analysis, and visualization to KM research
The research methodology used in the Wang et al. study is shown in Figure 2. It is very similar to the methodology used in the Breznik study discussed above.
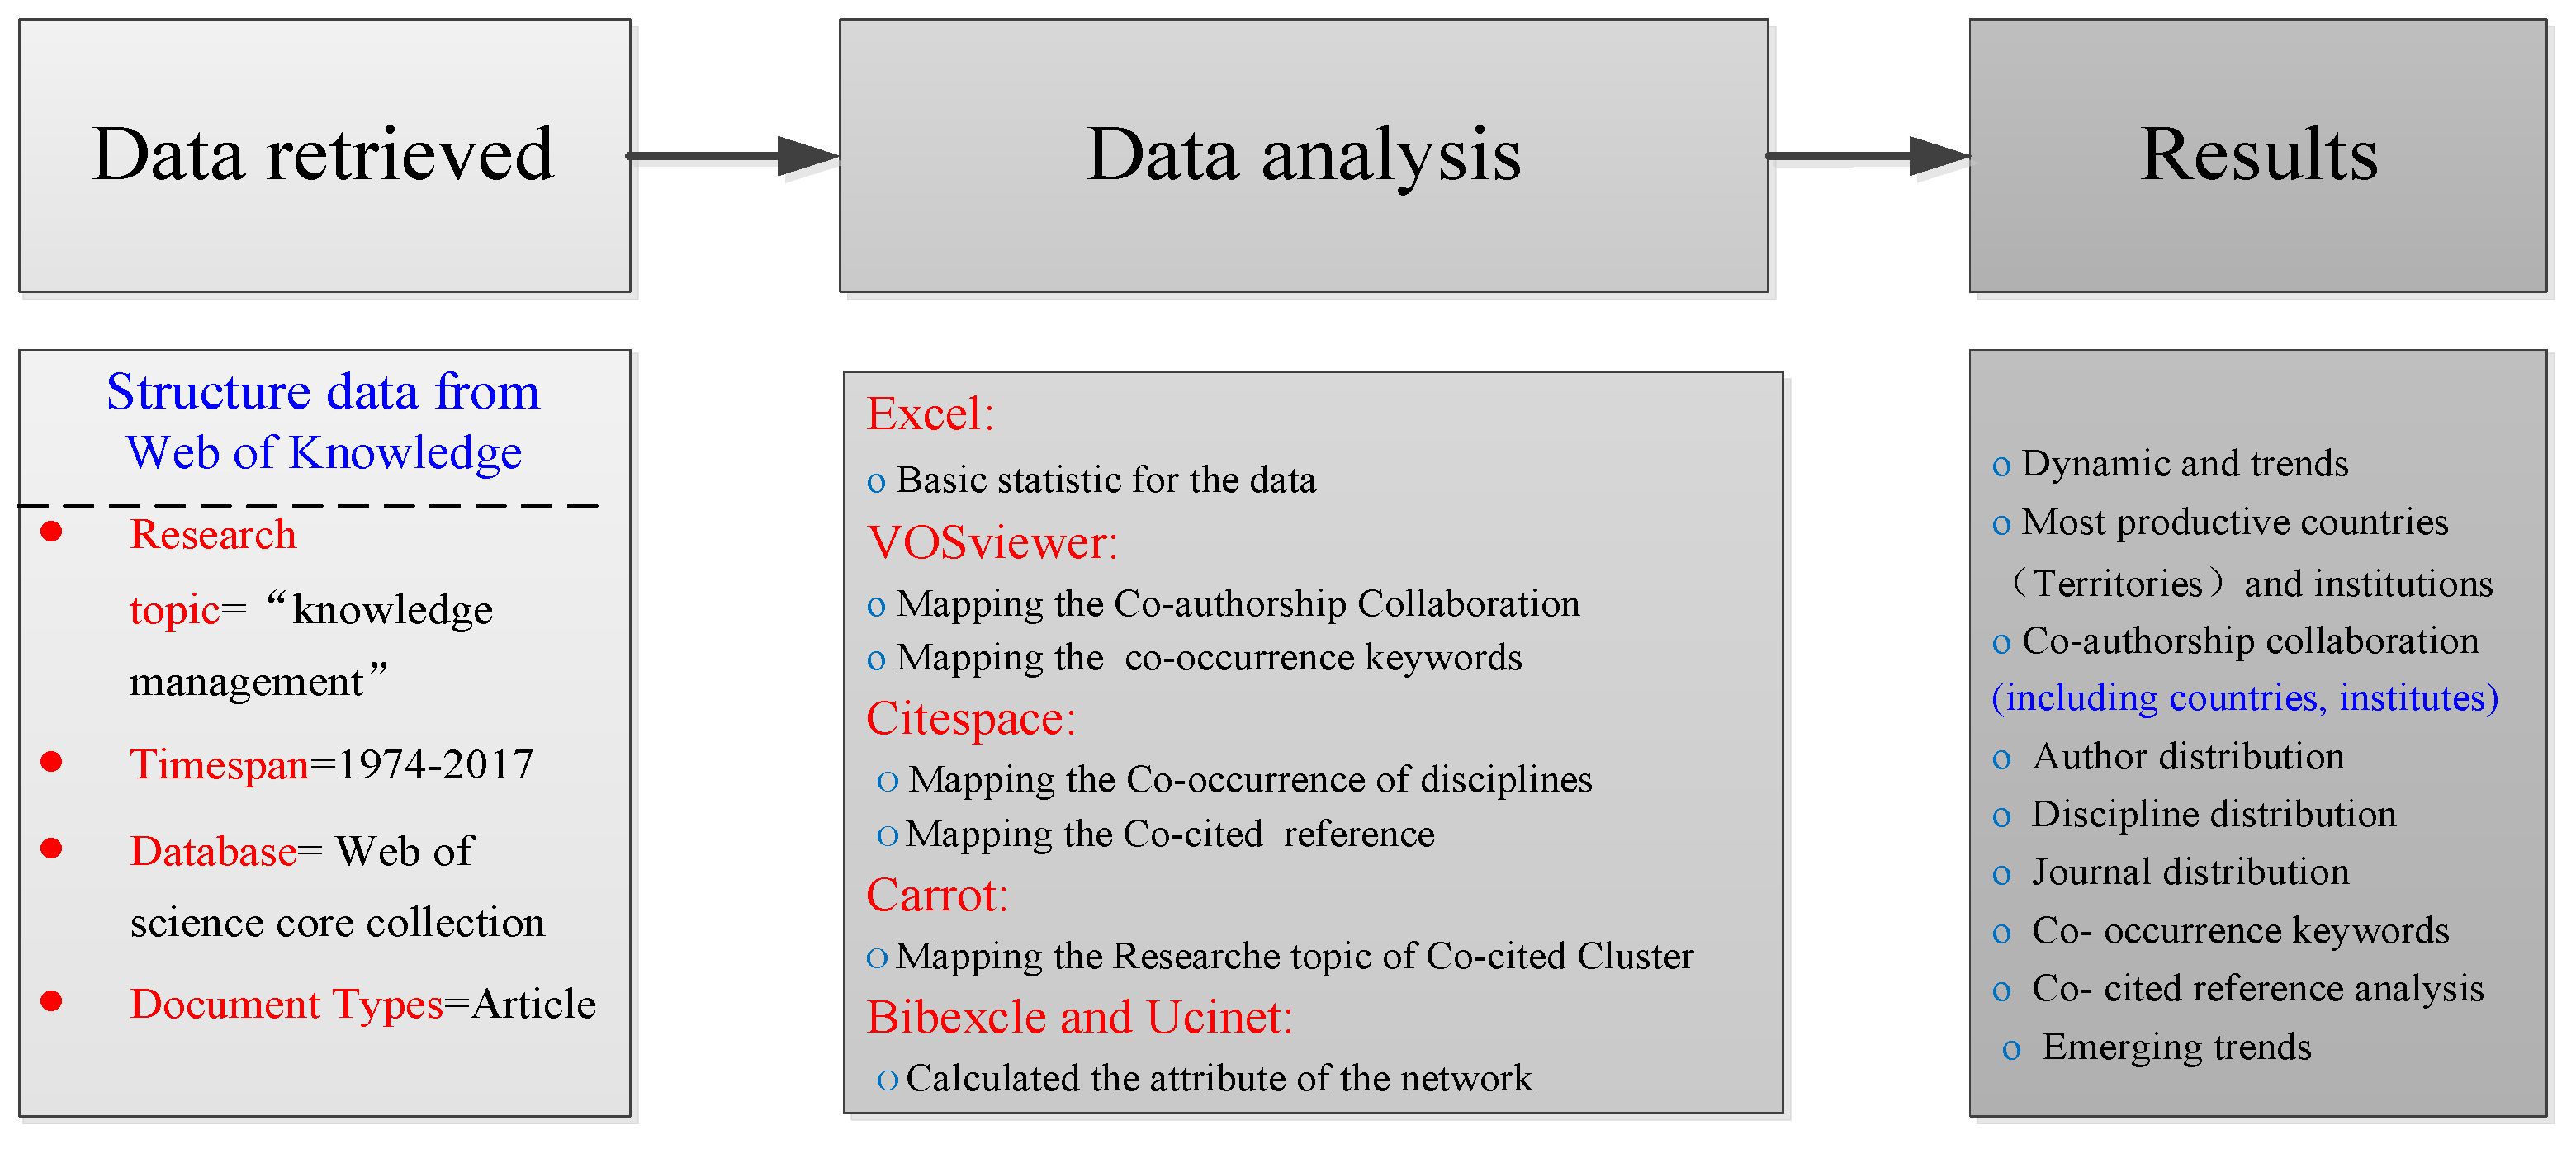
Like Breznik, Wang et al. used a number of other research tools in addition to developing a bibliometric profile of KM. For example, they used Bibexcel6 to construct a co-occurrence matrix, Citespace7 for co-citation analysis, Ucinet and VOSviewer for social network analysis and visualization, and Carrot for cluster analysis. Other tools such as Microsoft Excel were also used for basic statistical analysis and visualization of the bibliometric results.
Results
The key findings from the Wang et al. study are shown in Figures 3 through 8.
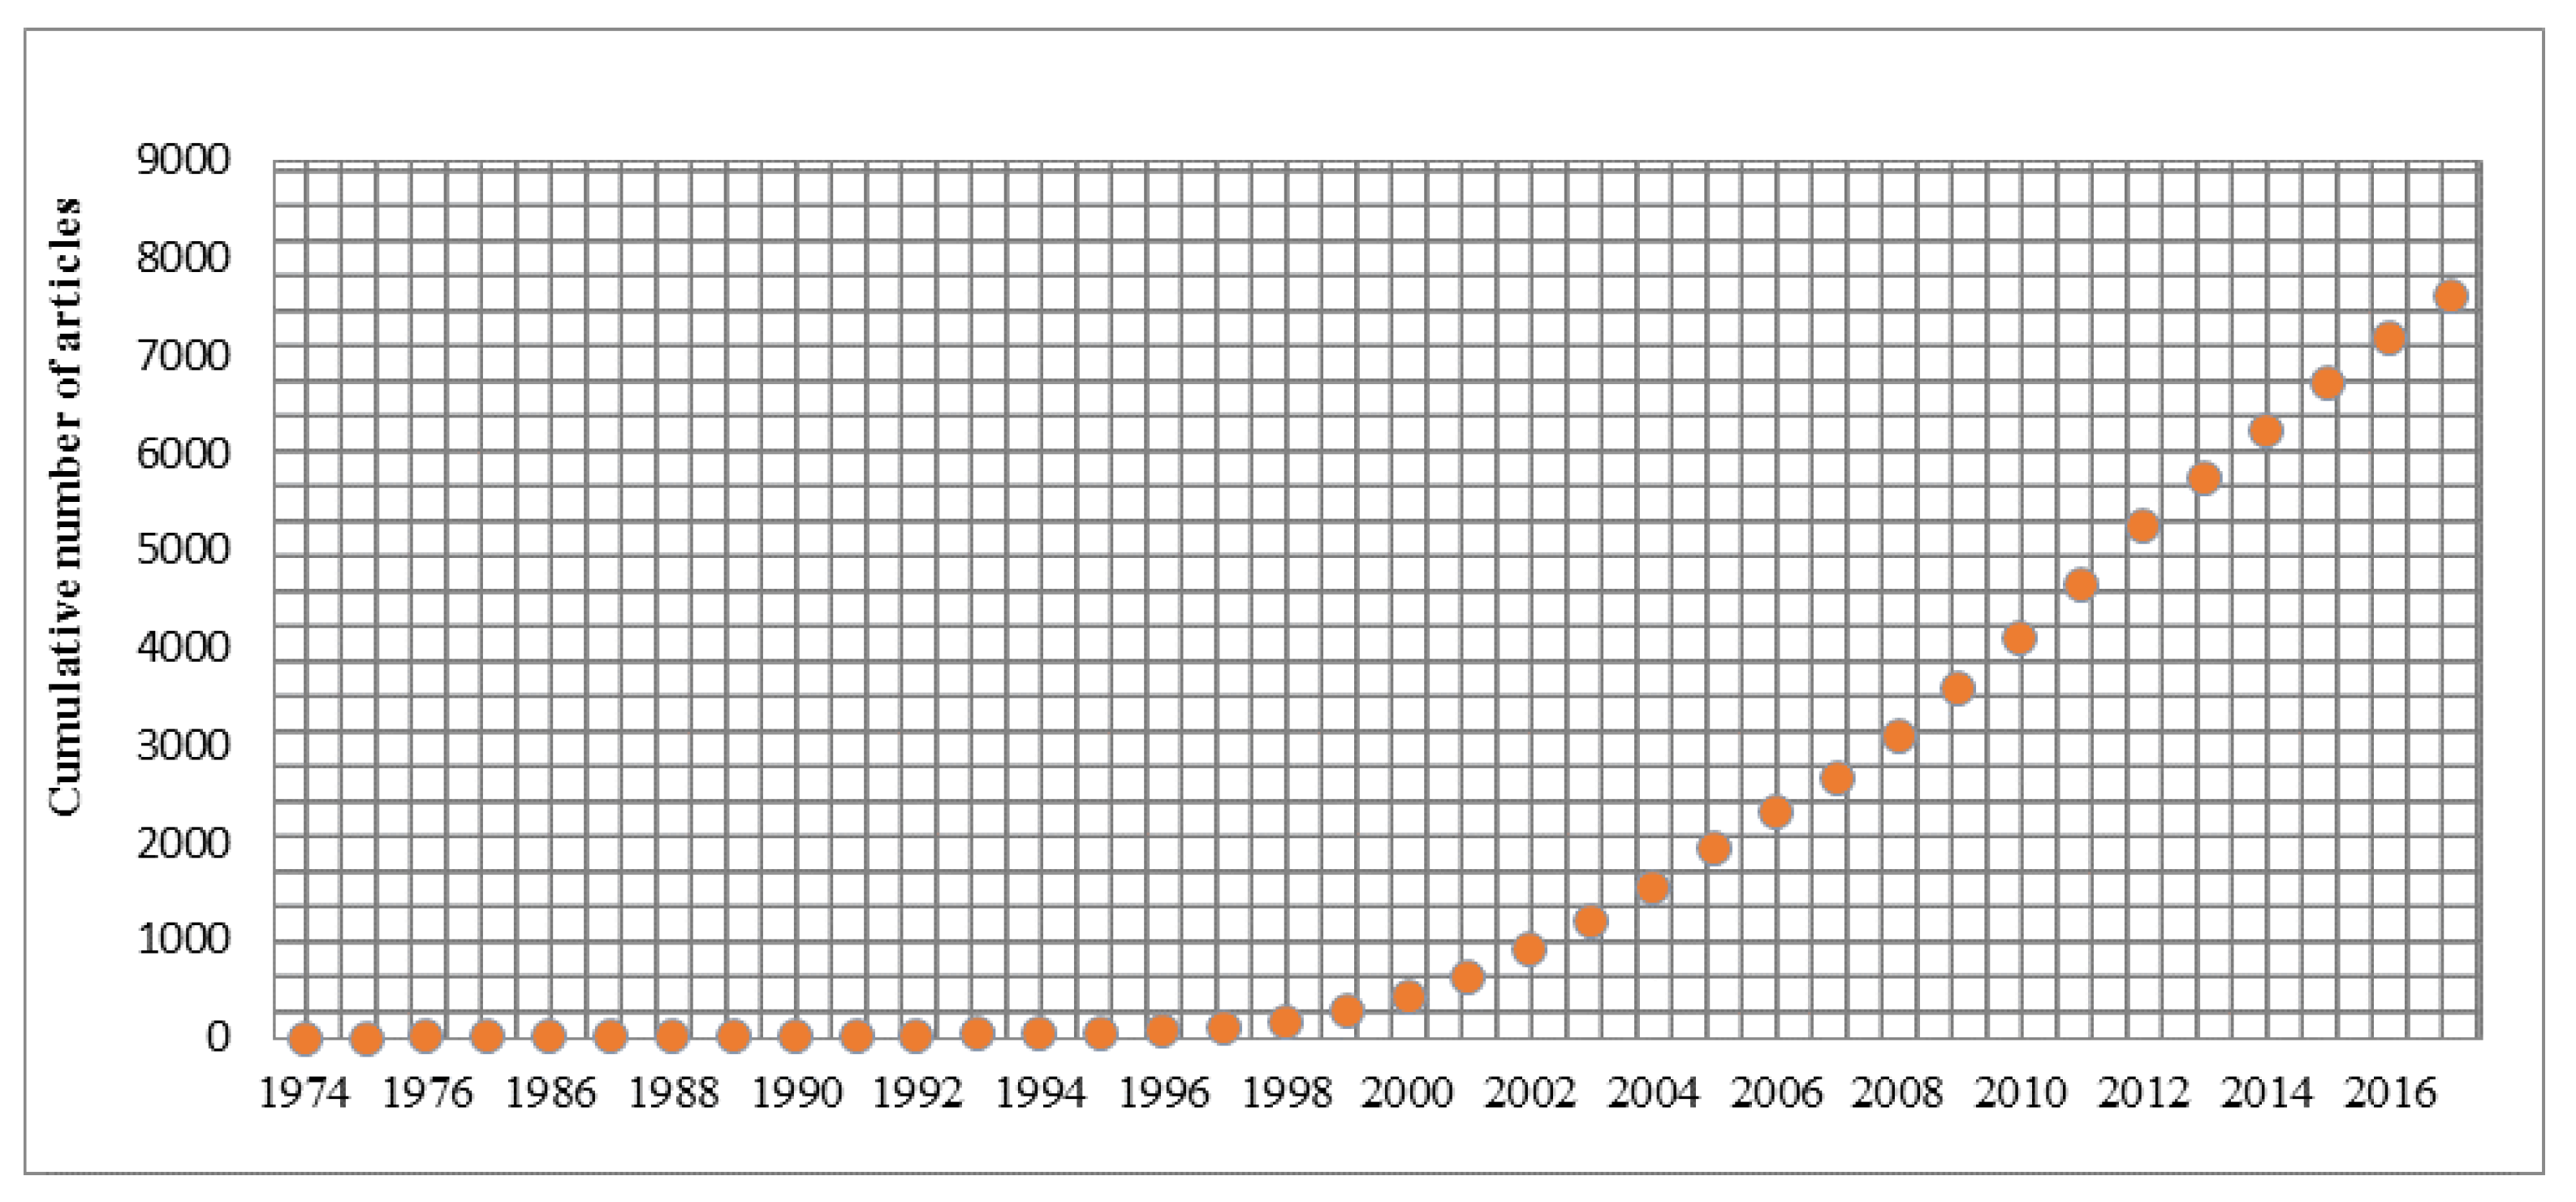
Cumulative growth in knowledge management publications
The cumulative growth in knowledge management publications from 1974 to 2017 is shown in Figure 3. Only one paper was published in 1974, with an increasing number of articles after 1999. Publishing reached a peak in 2012, when 588 articles were published. As Breznik had also found, from 2013 onwards there has been a steady decline in the number of articles published annually.
Geographic distribution of KM research articles
A total of 123 countries / territories participated in KM publication activities from 1974 to 2017. The primary contributing countries are shown in Figure 4. (See also the article “How do we fix the world’s very unequal knowledge – and knowledge management – map?”).
International collaboration between countries / territories engaged in KM research
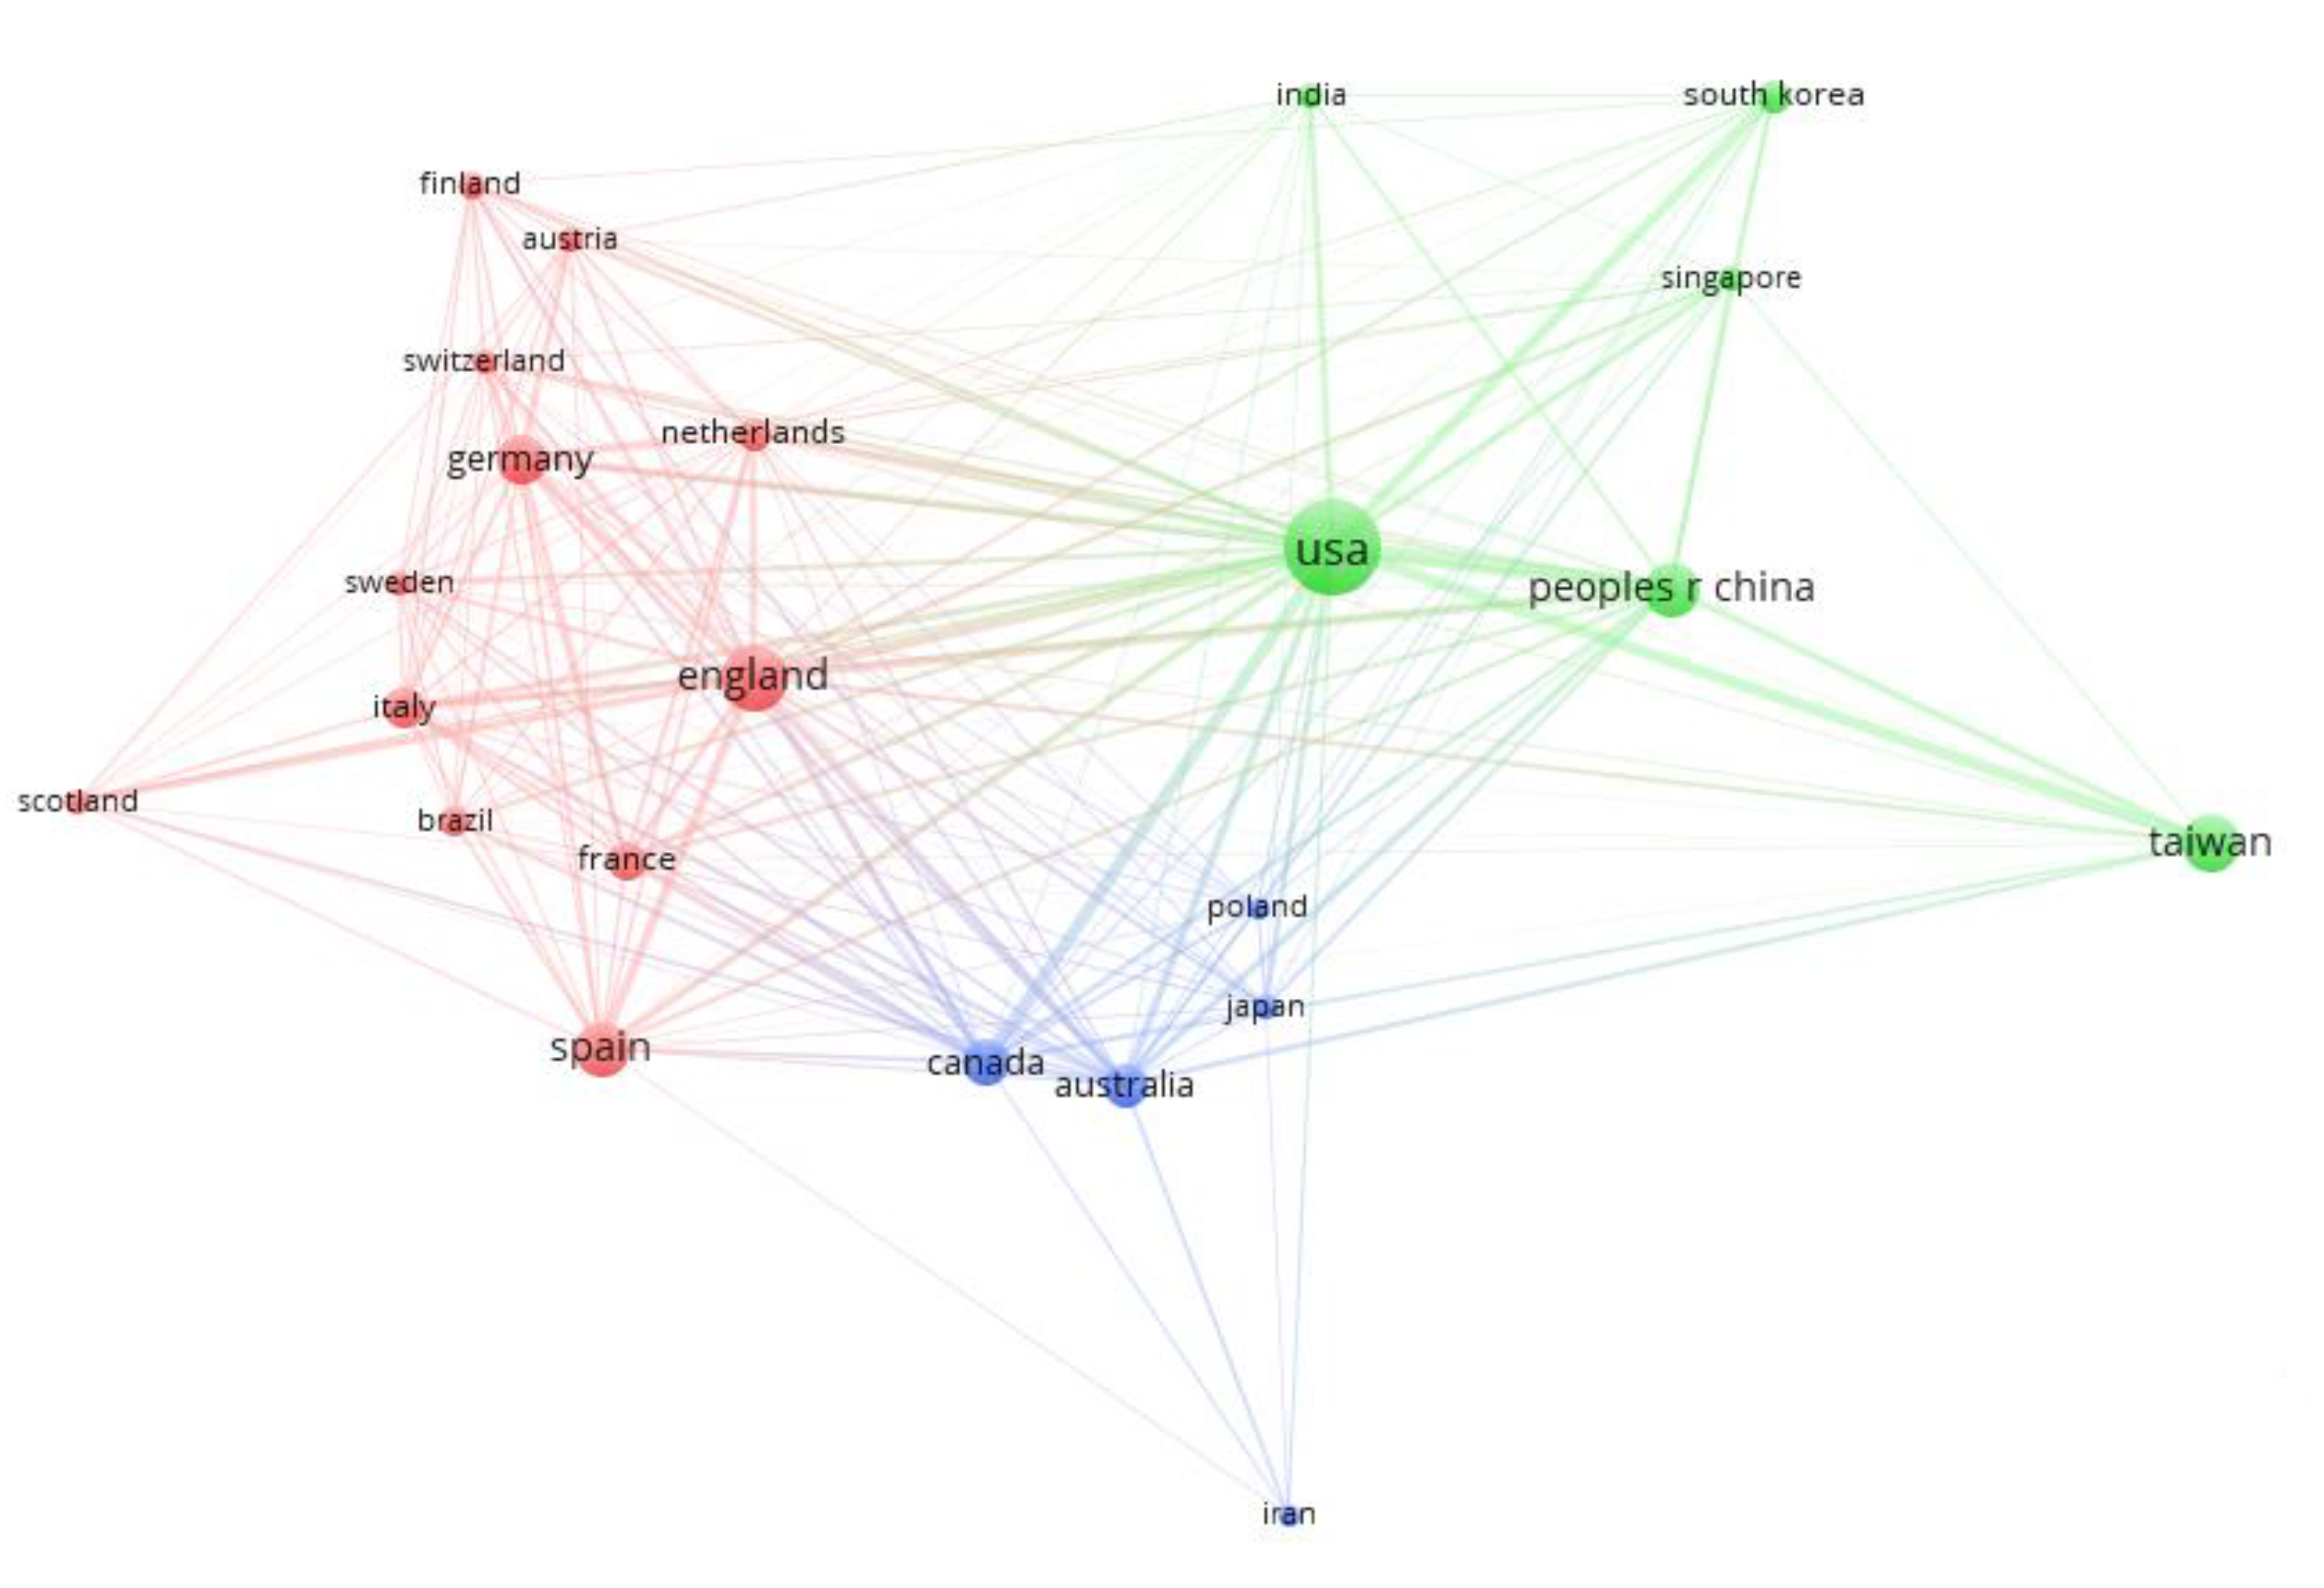
Wang et al. contend that international collaboration in science is both a reality and a necessity, and it is in the interest of all nations. Figure 5 shows the international collaboration network of the top 23 countries / territories involved in KM research. The thickness of the linking lines between any two countries / territories is directly proportional to their collaboration frequency.
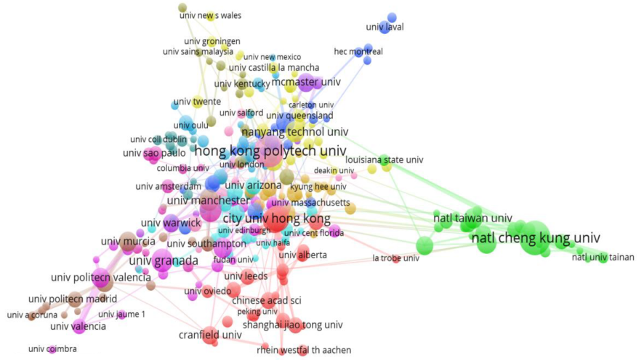
Collaboration between research institutions
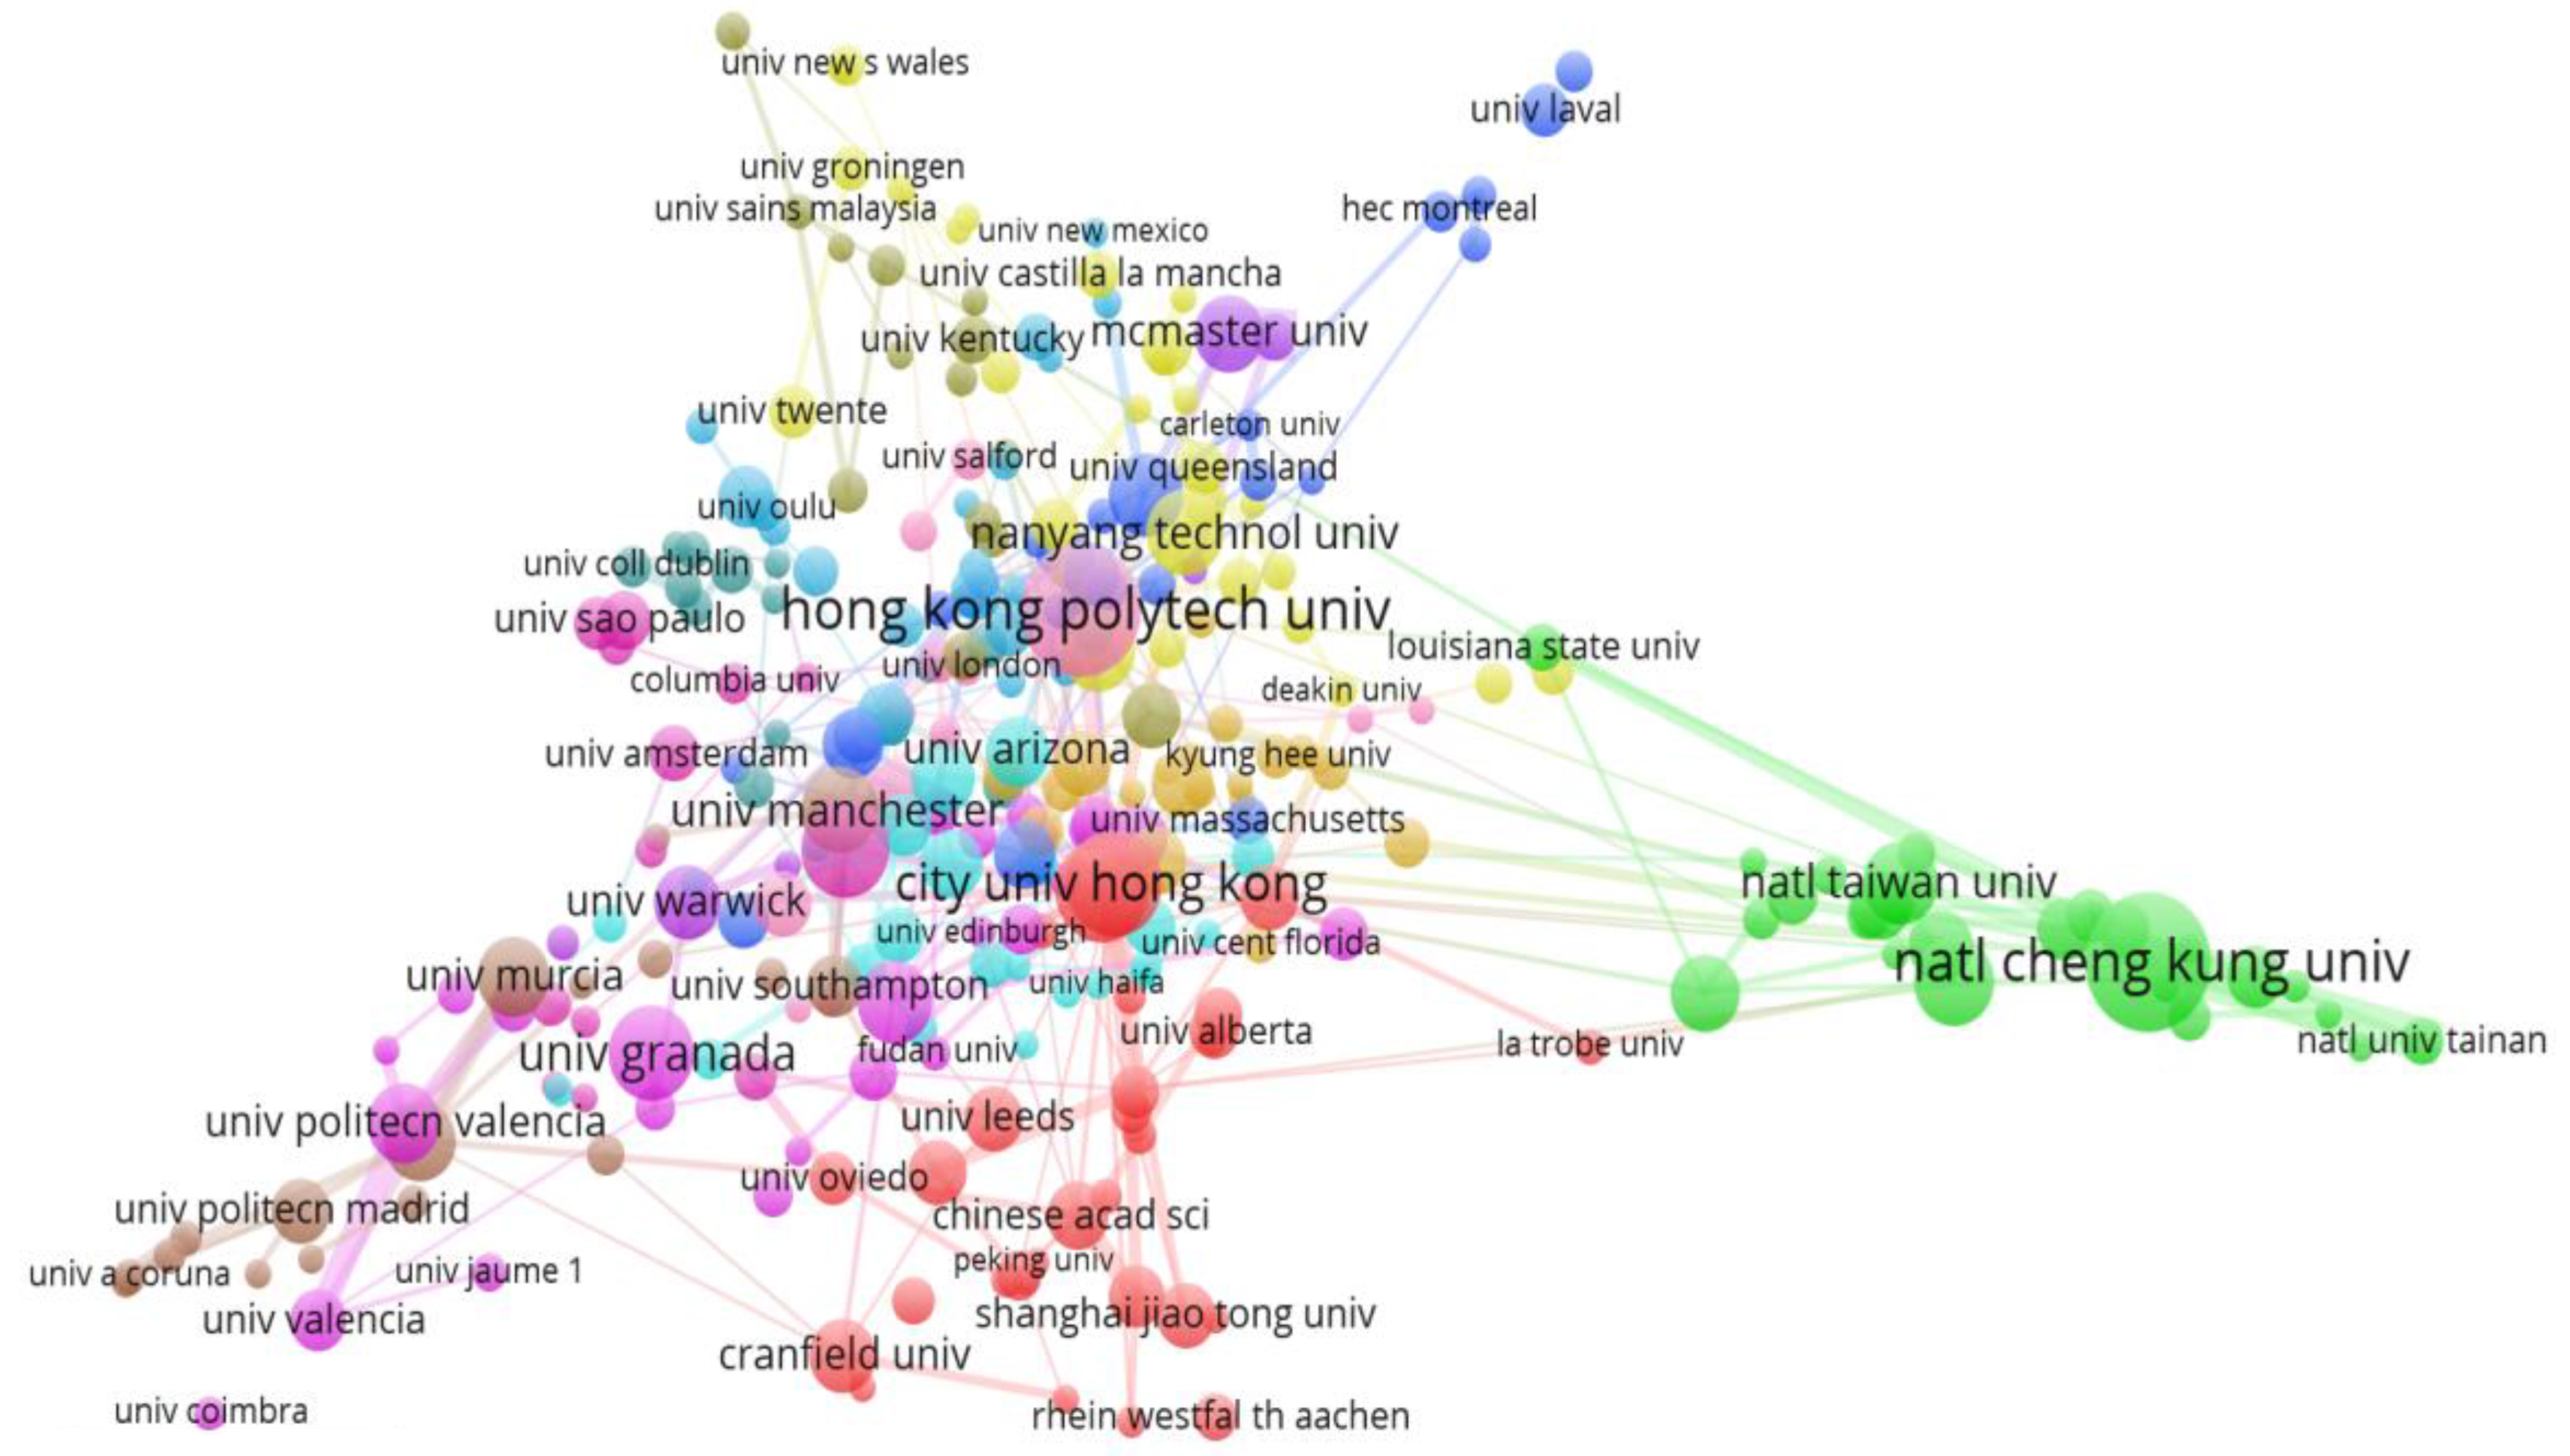
Figure 6 shows the collaboration network for institutions with more than two articles published. The thickness of the linking lines between any two institutions is directly proportional to their collaboration frequency.
Disciplines involved in KM
Figure 7 shows the top KM discipline categories ranked in terms of the number of publications.

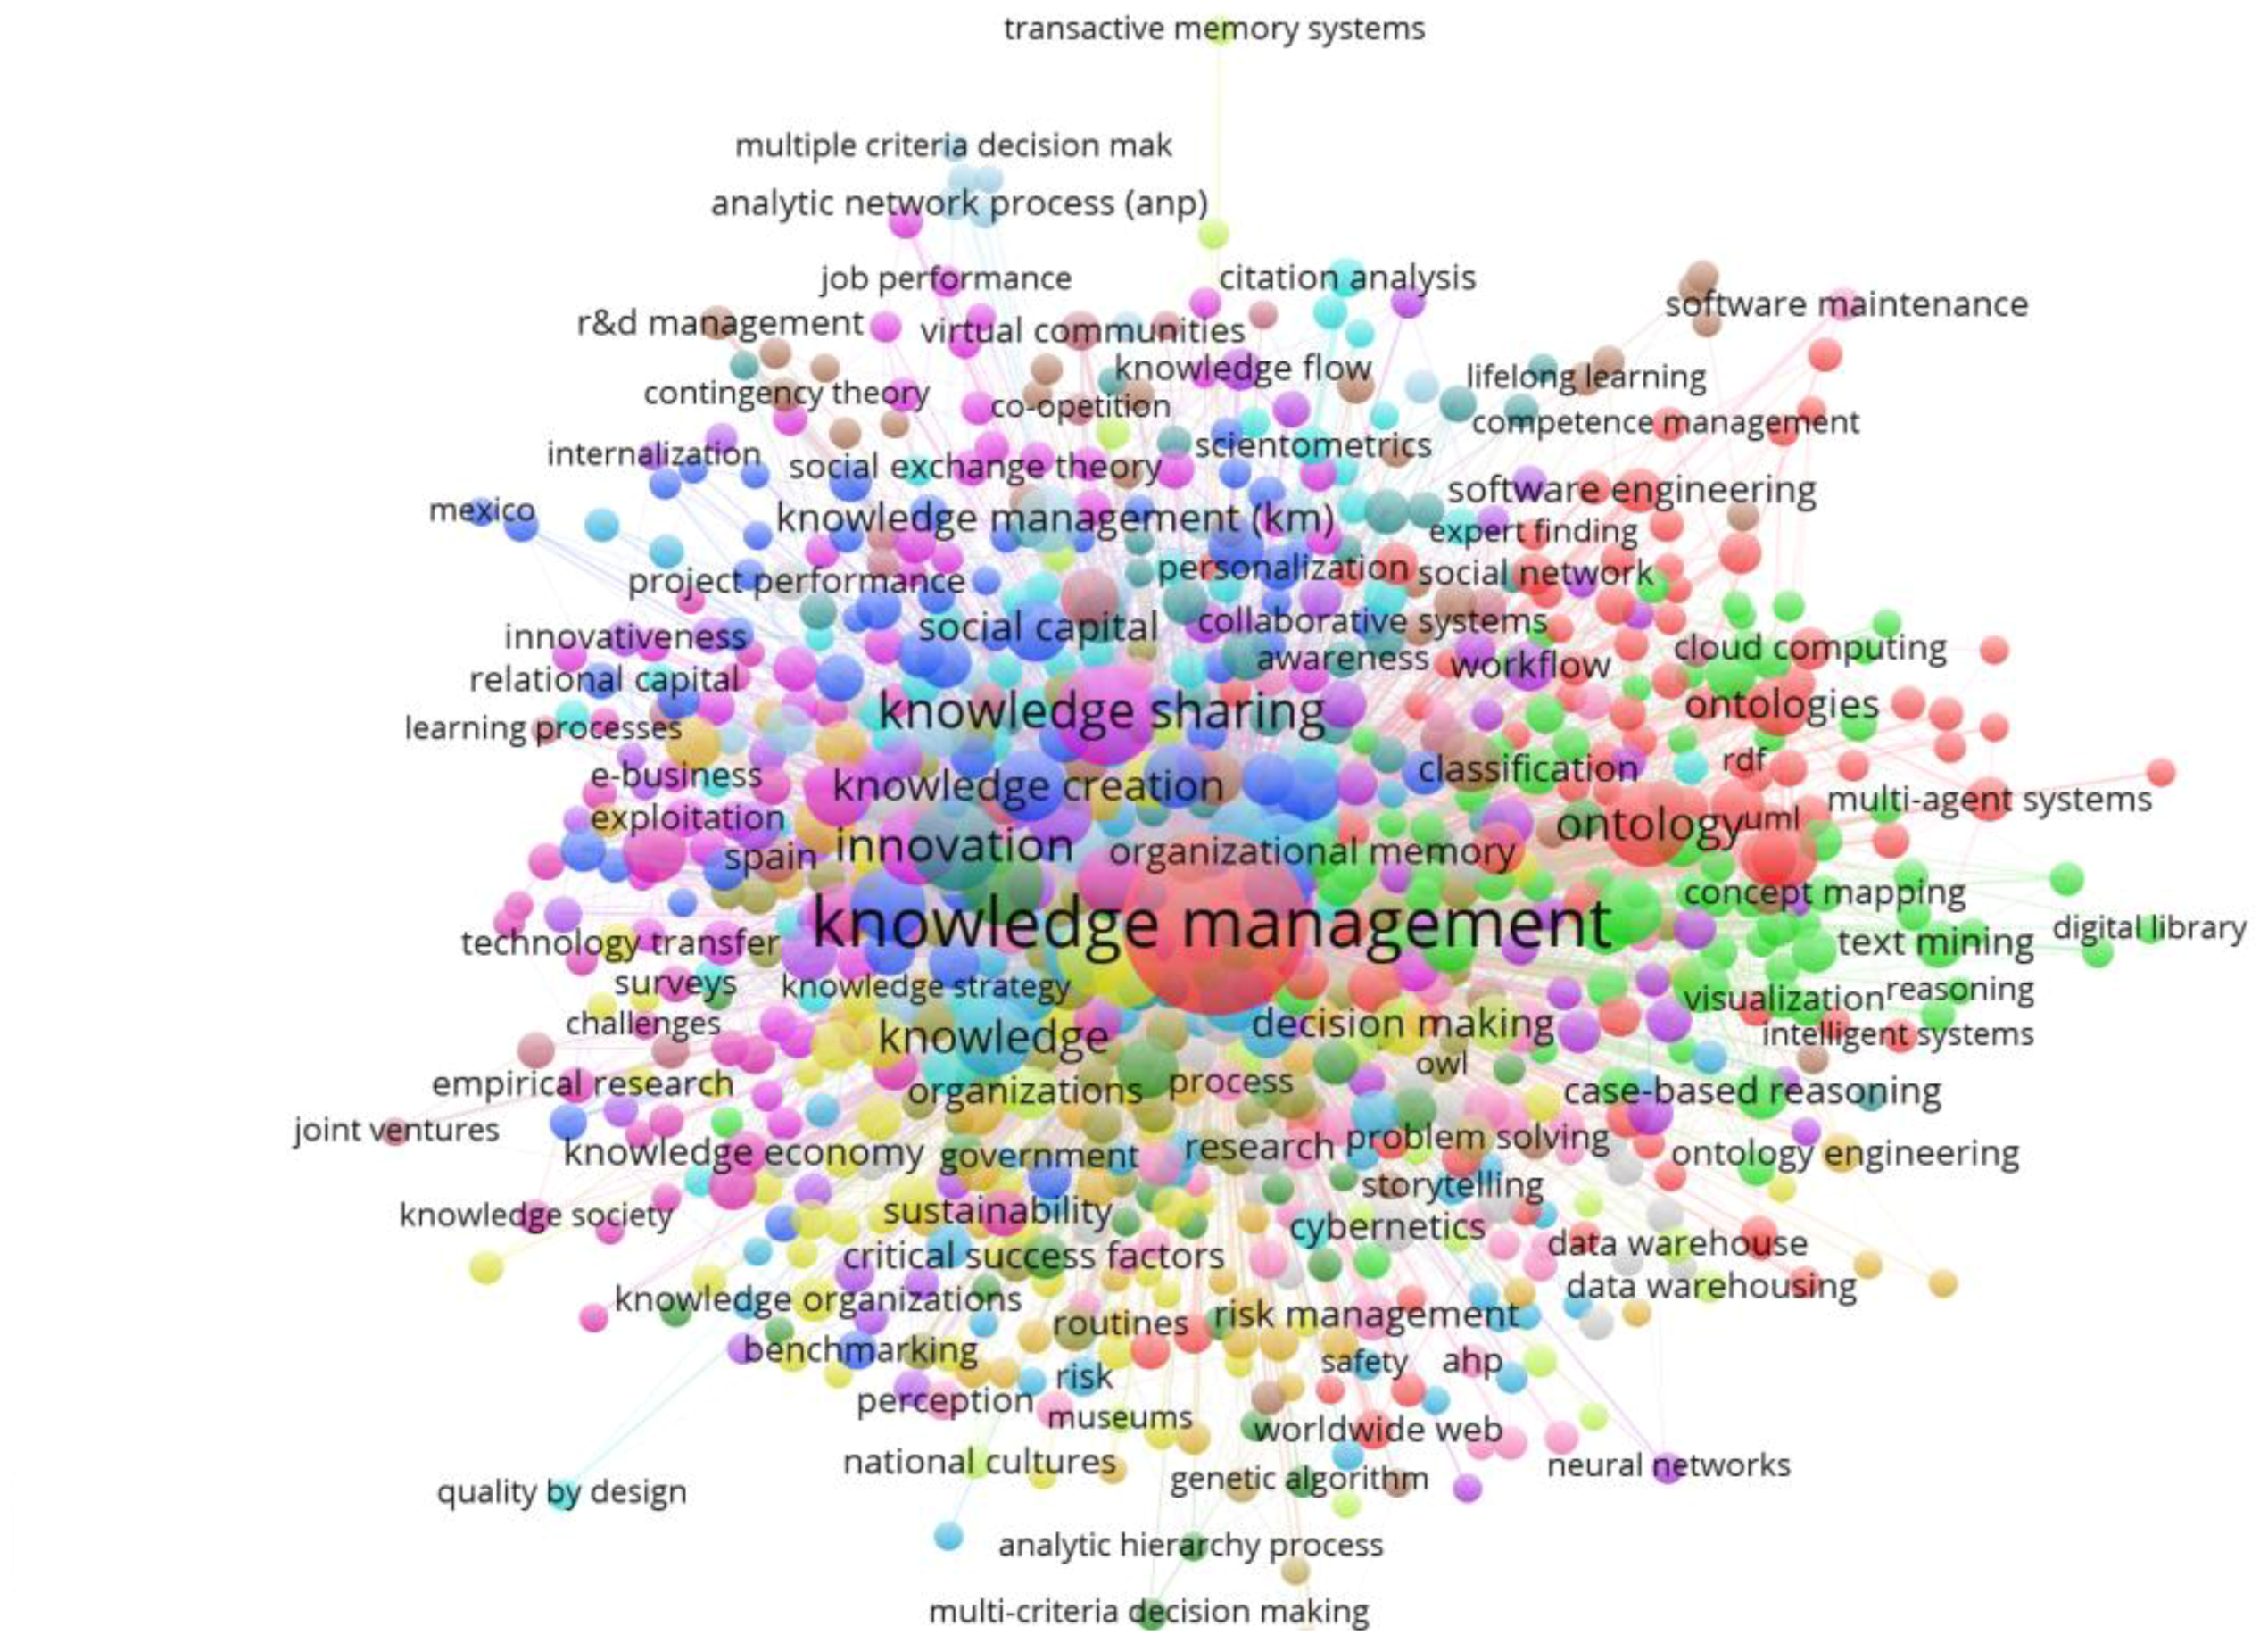
Co-word analysis
Figure 8 shows the co-words network of author keywords. Wang et al. advise that co-word analysis is based on the theory that research fields can be characterized and analyzed based on patterns of keyword usage in publications. The analysis reveals the concepts most closely associated with KM.
Article and header image source: Visualizing the Academic Discipline of Knowledge Management is licensed under CC BY 4.0.
References:
- Breznik, K. (2018). Knowledge Management–from its Inception to the Innovation Linkage. Procedia-Social and Behavioral Sciences, 238, 141-148. ↩
- Wang, P., Zhu, F. W., Song, H. Y., Hou, J. H., & Zhang, J. L. (2018). Visualizing the Academic Discipline of Knowledge Management. Sustainability, 10(3), 682. ↩
- Briner, R. B., & Denyer, D. (2012). Systematic review and evidence synthesis as a practice and scholarship tool. Handbook of evidence-based management: Companies, classrooms and research, 112-129. ↩
- Harden, A. (2010). Mixed-methods systematic reviews: integrating quantitative and qualitative findings. Focus, 2010(25), 1-8. ↩
- Pendlebury, D.A. (2010). White Paper: Using Bibliometrics in Evaluating Research. Philadelphia PA USA: Thomson Reuters. ↩
- Persson, O., Danell, R., and Schneider, J.W. (2009). How to use Bibexcel for various types of bibliometric analysis. In Celebrating Scholarly Communication Studies: A Festschrift for Olle Persson at his 60th Birthday. Umeå University Library: Umeå, Sweden, 9–24. ↩
- Chen, C. (2006). CiteSpace II: Detecting and visualizing emerging trends and transient patterns in scientific literature. Journal of the American Society for information Science and Technology, 57(3), 359-377. ↩