https://www.cfact.org/2021/07/09/if-only-i-believed-man-was-the-reason/
Think of your favorite Man-Made Global Warming Scientist.
Now, what if that person put out research that had 20 Major hurricane hits preceded by a cold May for the eastern US< and then a cold December that looked like the Mays.
Imagine if that scientist reveals this research. (btw that in itself is a long shot since you have to forecast all the time and be looking for ideas that are not obvious… which is what forecasting actually does if you do it long enough).
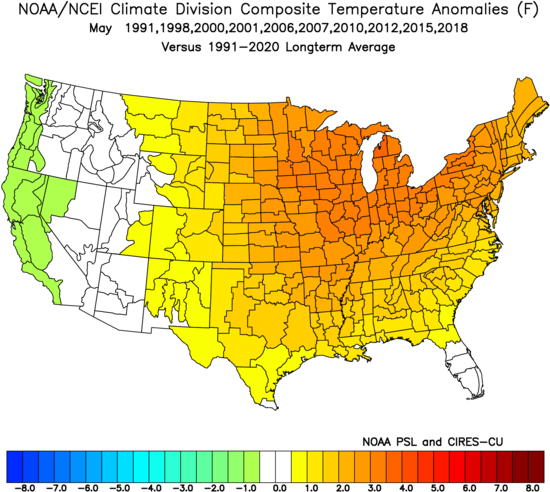
Mays with high impact hurricane season following them:
.png)
widespread cold right?
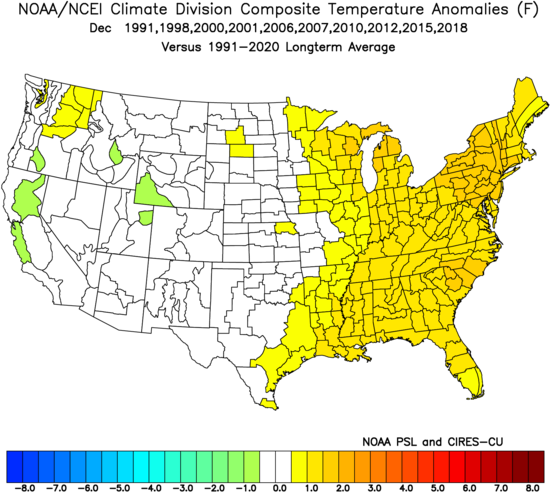
Now look at the following Decembers
.png)
Widespread cold.
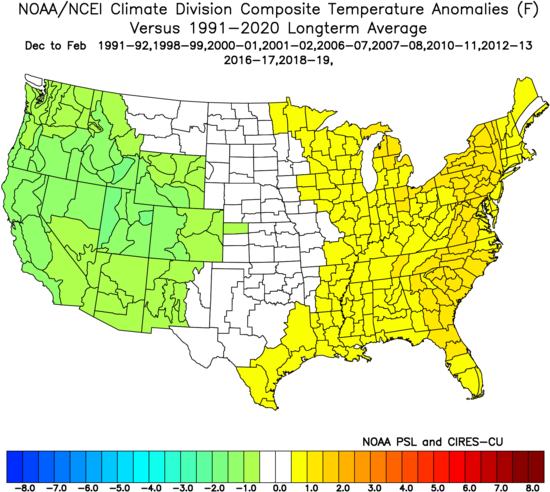
Following winters
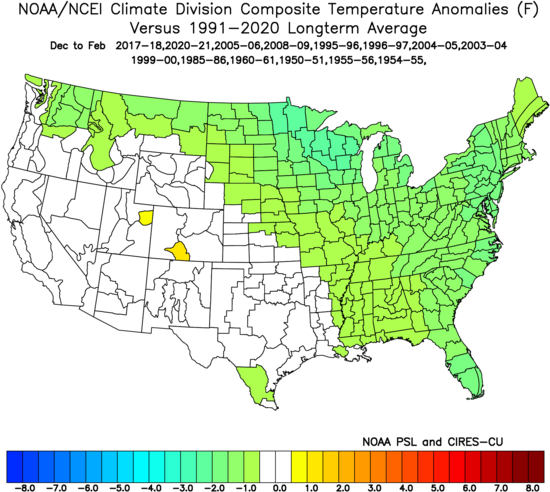
So cold May ( most likely due to high amplitude spring MJO trending toward phases 8,1,2,3), then big hurricane season, then cold December, and colder than average winter..which of course a lot of companies would love to know.
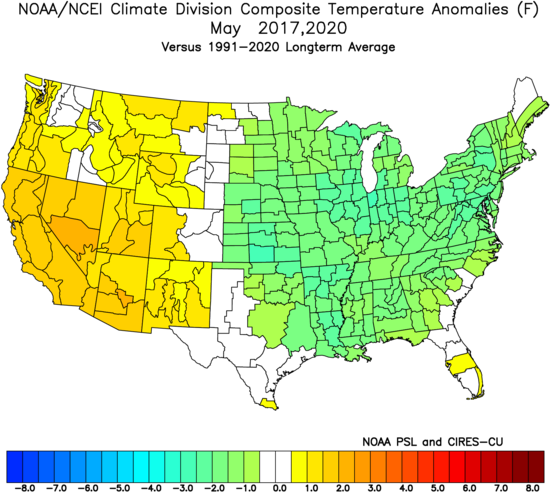
Now check out this May
.png)
widespread cool
and of course the Weatherbell.com forecast this year already has had 3 storms, though minor, move through the highest impact area relative to averages
.png)
So already the preseason idea is starting to show it has merit
Now check out the CFSV2, ( which like most models cant’ really see cool in the longer term anymore but hints at it where the normal is). for December
.gif)
The hypothesis is that the pattern that leads to the cold May, most likely the active spring MJO, if it continues its natural evolution has higher than average Us landfills, and that in turn is a signal for a colder start to winter over the east.
Last year we had this in December, there is the cool admittedly in the southeast but still there ( looked more el ninoish)
.png)
2017
.png)
what did those Mays look like?
And let’s remember what our impact forecast looked like last year
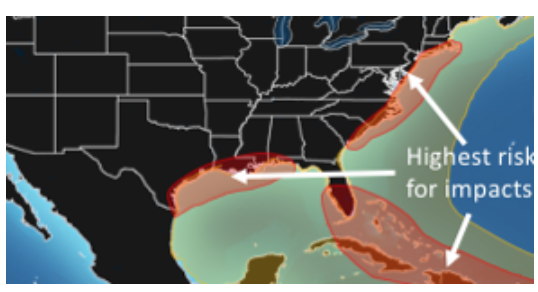
and then the nice postseason NOAA warning chart that showed how close we were
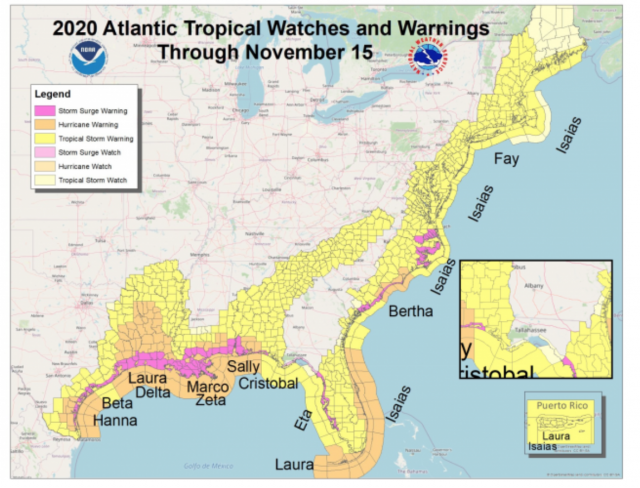
In any case, 14 cold Mays, the following hurricane seasons, and December and winter show strong linkage
In those 14 seasons, 20 Major hurricanes hit the US and December had a lot of cold in at least a part of the eastern US. More importantly, the entire winter tended to turn out cold. So the implication is if you nail the cold May and then the high impact season behind it, you have a tool that can see almost 9 months down the road for winter. How does that happen? The global pattern that sets up that kind of cold May can indicate the big impact season is coming ( this has been discussed in our preseason hurricane forecasts) and then left to its own accord, if it is moving along naturally, the result is the colder look for winter.
Now, look at these Warm Mays ( which would be the antilog). we have 10 samples)
ONLY ‘2 Major hurricane hits in 10 samples. So the cold May sample is about 1.3 majors a year, while the warm May sample is only .2 Major hits per year. That is a huge difference. And in addition, the magnitude of the difference indicates greater skill! But then taking it to the following Decembers.
And then the winters that followed
I believe this is too strong a correlation to ignore.
So think about this, None of this will see the light of day because of the source. Sure you see it. But something like this which could be a fascinating tool that shows some linkage, will not. But you can be darn sure if it was someone that was in the hierarchy of AGW and then somehow said it’s because of man-made warming, well guess what. Would have a better chance than right now.
But do not think I am upset. In the end, if I am who I say I am, I have to work in front of the good lord. And the best way to do that is to be right and to be happy no matter who sees it. Or if seeing it, raises curiosity. And it gets the reader to think, wow this guy takes it to the limits to get an answer.
An answer that is not always right if the natural progression changes, But if the link of the progression of the pattern from the cold Mays, to the hurricane season and then they continue along that line, we have a good idea of where winter is going.
Why can this possibly have any merit? Because the large-scale feedback of the atmosphere over a long time scales sets in motion action and reaction that may indeed be more obvious due to the distorted warming and increased water vapor. But it would take a lot of research, And in what we do, we real-time test our ideas for you to see. But if I was at a university, I could see the way something like this could fund a grad student or two’s master thesis. And guess what, I suspect the MJO amplitude in the spring is involved. ( another sorely needed subject for research
But for now, I can only wonder, if I were at a prominent Man-made warming person if something like this would be getting attention
Then again it is longer than a sound bite, so maybe not.