The proof is in the pudding – knowledge visualization types and examples [Knowledge visualization series part 6]
This article by Hanlie Smuts is part 6 (and the final part) of a series of articles exploring knowledge visualization aspects from an organizational perspective.
Knowledge visualization refers to the application of visual representation techniques from multiple visualization domains aiding knowledge-intense processes such as knowledge sharing among employees in an organization. In the past 5 parts of a series of articles discussing a knowledge visualization framework from an organizational perspective, this final part presents some knowledge visualization types and examples. In the table below, I collated knowledge visualization types presented by scholars1. This is by no means all the possibilities, but I wanted to illustrate application with some example types. In addition, the type of knowledge visualization that you choose will be guided by the purpose of the knowledge exchange required i.e. do you need to motivate a team, generate new insights, promote knowledge recall or coordinate efforts.
| Type | Description |
| Sketches |
|
| Diagrams |
|
| Maps |
|
| Knowledge maps |
|
| Concept maps |
|
| Images |
|
| Objects |
|
| Interactive visualizations |
|
| Visions / stories |
|
By applying the principles shared as part of the organizational perspective knowledge visualization framework, some examples of knowledge visualizations may be considered. I have only extracted a few examples to illustrate the potential. For each example, I have indicated the source.
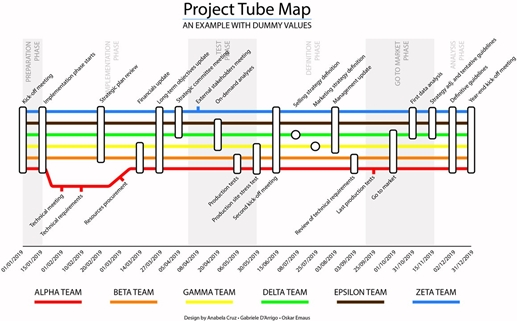
In the image below (Figure 1), a tube map (extract) was used as a knowledge map to represent a project. The tube lines represent a group of recipients and the stations project milestones. The visualization clearly presents which recipients contribute to a particular milestone. The purpose of this knowledge visualization was to share a complex project with different target groups, to create a mutual narrative, to attract and motivate employees, to provide an overview and detail in one image, to initiate discussions and to foster understanding.
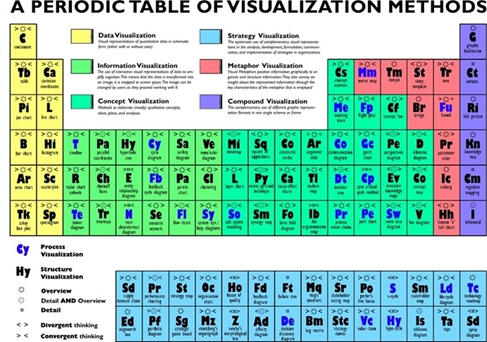
The periodic table (Figure 2) was used as a visual metaphor to classify 100 different methods of visualization. Groups, recognizable through the same background color, contain visualizations of the same application area, which are categorized into data-, information-, concept-, metaphor-, strategy- and compound visualization. For each element it is indicated whether the method provides detail, overview or both, whether convergent vs. divergent thinking is required and whether structure or process need to be represented. This visualization provides an overview of a variety of different visualization methods and guides towards the correct method to be applied for the particular problem you want to resolve.
Scholars used the image of a bridge to share how to lead successful negotiations (Figure 3). This visualization is based on the negotiation method of Best Alternative To a Negotiated Agreement (BATNA).

In conclusion, research regarding knowledge visualization has been published since the early 2000’s as you can see from the references shared in these articles. Yet, its adoption for knowledge sharing in an organizational context seem to be low.
From an organizational perspective, the application of knowledge visualization enables the organization to manage large volumes of knowledge that need to be shared for the purpose of cross community learning and engagement. Furthermore, in an environment where employees have to cope with fast changing environments, knowledge visualization stimulate imagination and new ideas while minimizing ambiguity. From a knowledge perspective, knowledge visualization facilitates the re-use of knowledge, encourage development of mental models and improve comprehension.
Happy knowledge visualizing in your organizations!
Header image source: Gerd Altmann on Pixabay, Public Domain.
Reference:
- Eppler, M. J., & Burkhard, R. A. (2008). Knowledge visualization. In Knowledge management: concepts, methodologies, tools, and applications (pp. 781-793). IGI Global. ↩