The vital knowledge missing from Australia’s bushfire crisis debates: Part 1 – What can climate history tell us?
This article is part 1 of a two-part series exploring vital knowledge that has been missing from debates in regard to the causes of Australia’s horror bushfire crisis in the summer of 2019-20.
Over the past three months, Australia has been facing a horror bushfire crisis that has made international headlines. The fires have burnt through more than more than 15 million acres of land, with at least 24 lives lost and almost 2,000 homes destroyed. Estimates of the numbers of native animals killed range from 500 million to one billion, and countless numbers of livestock have also been killed. As well as the serious loss of life and property, the fires have been are causing unprecedented levels of air pollution, and will also cause water contamination into the future. And the crisis appears to be far from over.
The bushfire crisis has sparked a war of words in the mainstream media and on social media, particularly in regard to the causes of the fires. The debates in this regard primarily centre around two themes:
- The role of climate change. Some argue that climate change has played a pivotal role in causing the fires, while others argue that the fires are part of a natural cycle. Then, there are others who argue that arson and/or a lack of hazard reduction burning are the primary cause(s) of the fires.
- The role of hazard reduction burning. Some argue that the fires have been caused by an excessive buildup of flammable “fuel load” material made up of forest undergrowth plants and fallen branches and leaves. Some of these critics also argue that this situation has been exacerbated by restrictive policies that prevent the conduct of controlled hazard reduction burns to reduce this fuel load. Others dismiss this, saying that hazard reduction burning has been conducted to the greatest extent possible. Then, there are others who argue that returning to Aboriginal “cultural burning” practices will solve the problem.
In each of these debates, however, vital knowledge has been missing, in particular important published research and historical evidence in regard to climate history and the role of fire in the Australian landscape.
I will present this knowledge in a two-part series, beginning with this article. The aim is to stimulate more informed debates around the causes of the bushfire crisis, and to also highlight how knowledge needs to be better used in regard to complex issues such as bushfire management. Some of this knowledge supports some of the conclusions that have been drawn, while some of it will shake the foundations of some commonly held beliefs right to their core.
What can climate history tell us?
Before I present vital climate knowledge that has so far been missing from the bushfire debate, I first need to establish my credentials in regard to the matters I will discuss. Stephen Bounds alerts to the increasing value of this step in a world where disinformation has eroded trust. There has certainly been a deluge of disinformation in regard to the bushfire crisis.
My more than 20 years of work in environmental management in the Australian states of New South Wales (NSW) and Queensland has included biodiversity conservation, river management, and catchment and land planning. Fire management planning has been an important aspect of my biodiversity conservation work. All of my work has focused strongly on ensuring that decision-making has made the best possible use of knowledge, and I’ve documented several examples of such actions in RealKM Magazine, including examples of my work in highly complex contexts. I also have a Master of Environmental Management with Distinction degree which included studies of climate science and conservation biology.
It’s more than just the IOD and SAM
Australian Government Bureau of Meteorology briefings in regard to the climate drivers influencing the bushfire crisis have focused heavily on the Indian Ocean Dipole (IOD) and Southern Annular Mode (SAM), for example as shown in the following video:
These two climate drivers operate over relatively short timescales – around three years for the IOD and a matter of just weeks for the SAM. However, one of the river management projects I worked on introduced me to two climate cycles that operate over much longer timescales – up to 60 years.
This project involved the determination of new environmental flow releases from a dam on the Shoalhaven River, which is located south of Sydney in southeastern Australia, in the centre of the bushfire crisis area. Environmental flows are used to help mitigate the impacts of dams on downstream flora and fauna.
The two longer timescale climate drivers are the Pacific Decadal Oscillation (PDO) and Interdecadal Pacific Oscillation (IPO). A 2015 paper1 advises that the PDO and IPO are essentially the same thing:
Interdecadal variability of the Pacific sea surface temperatures (SSTs) has been documented in numerous studies. Various indices have been developed to quantitatively describe the ENSO-like multi-decadal climate variations, often referred to as the Pacific Decadal Oscillation (PDO) or the Interdecadal Pacific Oscillation (IPO). The PDO and IPO are essentially the same interdecadal variability, with the PDO traditionally defined within the North Pacific while the IPO covers the whole Pacific basin.
ENSO is the El Niño–Southern Oscillation, which is another significant driver of Australia’s climate.
How the PDO / IPO affects the climate of southeastern Australia
The index values for the Pacific Decadal Oscillation (PDO) are shown in the following graph:
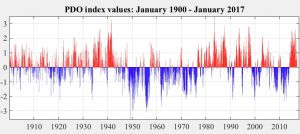
Positive index values correlate with lower rainfall in eastern Australia, and negative index values correlate with higher rainfall. This correlation can be clearly seen in the following graph of total annual flows2 in the Shoalhaven River:
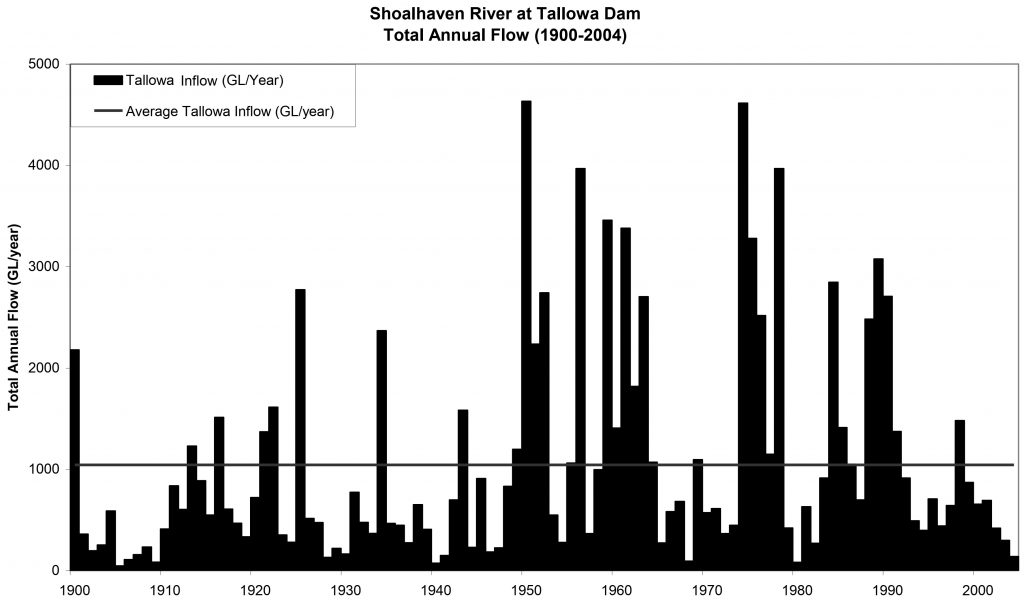
South-eastern Australia experiences marked climatic cycles of wetter-than-average conditions (these are called Flood-Dominated Regimes, or FDRs) and drier-than-average conditions (these are called Drought-Dominated Regimes, or DDRs). FDRs and DDRs can last from 30 to 50 years. Historical records of flows in the Shoalhaven River can be examined to identify FDR and DDR periods … 1900-1948 was a drier-than-average period (or DDR) in the Shoalhaven catchment; 1949-1990 was a wetter-than-average period (or FDR), and the period from 1991 to the present is another DDR.

Significant correlations be-tween the IPO and local P [precipitation] are observed over eastern Australia, southern Africa and the Southwest U.S. The IPO also modulates ENSO’s influence on local T [temperature] and P [precipitation] over most of these regions.
The Pacific Decadal Oscillation (PDO) is a major forcing of inter-decadal to quasi-centennial variability of the hydro climatology of the Pacific Basin. Its effects are most pronounced in the extra-tropical regions, while it modulates the El Niño Southern Oscillation (ENSO), the largest forcing of global inter-annual climate variability. Palaeo-PDO indices are now available for at least the past 500 years. Here we show that the >500 year PDO index … is highly correlated with inflows to the headwaters of Australia’s longest river system, the Murray-Darling.
This study investigates the influence of the El Niño–Southern Oscillation (ENSO) and the Interdecadal Pacific Oscillation (IPO) on rainfall and streamflow regimes of eastern Australia. An analysis of historical rainfall and streamflow data for Queensland (QLD), New South Wales (NSW), and Victoria (VIC) reveals strong relationships between these indices and seasonal rainfall and streamflow totals. Rainfall and streamflow in NSW and QLD are shown to be significantly enhanced during the La Niña phase of ENSO.
How the PDO / IPO affects bushfires in southeastern Australia
Given the correlation between the PDO / IPO and the climate of southeastern Australia, it’s not surprising that published research papers also support a correlation with bushfire risk in this area.
For example, a 2004 paper9 states that:
This study investigates the influence that the El Niño/Southern Oscillation (ENSO) and the Inter-decadal Pacific Oscillation (IPO) have on long term daily weather conditions pertinent to high forest fire danger in New South Wales, Australia. Using historical meteorological data for 22 weather stations to compute the daily value of McArthur’s Forest Fire Danger Index (FFDI), it is shown that a strong relationship exists between climate variability, on a range of time scales, and forest fire risk. An investigation into the influence of ENSO on fire risk demonstrates that the proportion of days with a high, or greater than high, fire danger rating is markedly increased during El Niño episodes. More importantly, this study also shows that the already significantly enhanced fire danger associated with El Niño events was even further increased during El Niño events that occurred when the IPO was negative. The potential to use simple indices of climate variability to predict forest fire risk is therefore demonstrated to be significant.
So does this mean that climate change isn’t responsible?
No, absolutely not. The evidence I’ve presented above shows that there is a large degree of climatic variability in southeastern Australia, and that this variability is a contributing factor to the bushfire crisis in that part of Australia. But that doesn’t mean that climate change isn’t also a factor.
The Australian Government Bureau of Meteorology has just released its annual climate statement showing that 2019 was:
- Australia’s warmest year on record, with the annual national mean temperature 1.52 °C above average
- Both mean annual maximum and minimum temperatures above average for all States and the Northern Territory
- Annual national mean maximum temperature warmest on record (2.09 °C above average)
- Widespread warmth throughout the year; January, February, March, April, July, October, and December all amongst the ten warmest on record for Australian mean temperature for their respective months
- Significant heatwaves in January and in December
- Australia’s driest year on record
- Nationally-averaged rainfall 40% below average for the year at 277.6 mm
- Rainfall below average for most of Australia
- Rainfall above average for parts of Queensland’s northwest and northern tropics
- Much of Australia affected by drought, which was especially severe in New South Wales and southern Queensland
- Widespread severe fire weather throughout the year; national annual accumulated Forest Fire Danger Index highest since 1950, when national records began
- One of the strongest positive Indian Ocean Dipole events on record; El Niño–Southern Oscillation neutral throughout the year
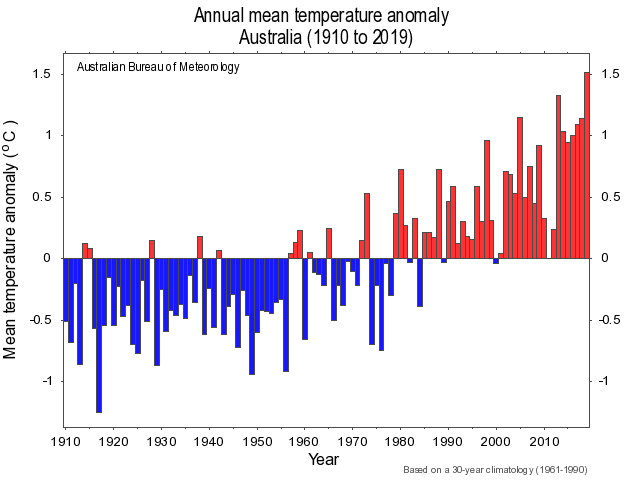
The annual mean temperature anomaly for 1910 to 2019 is shown in the following graph, with annual national mean temperature progressively increasing over this time to be 1.52 °C above average in 2019:
This progressive temperature increase is climate change. It is coming on top of not only the strongest Indian Ocean Dipole (IOD) on record and the influence Southern Annular Mode (SAM), but also a well-advanced Pacific Decadal Oscillation (PDO) / Interdecadal Pacific Oscillation (IPO) influenced Drought-Dominated Regime (DDR) that has been progressively drying the landscape of southeastern Australia.
All of these factors coming together has created an unprecedented climate bomb. Each one of these factors on their own would have been unlikely to have caused something of the scale and seriousness of the current bushfire crisis. However, similarly, removing any one of these factors to leave all of the others would also have been unlikely to have caused something of the scale and seriousness of the current bushfire crisis. This means that climate change is a contributing factor to the current crisis, and it’s the same with all of the other factors.
However, the most disturbing aspect of leaving knowledge in regard to the Pacific Decadal Oscillation (PDO) / Interdecadal Pacific Oscillation (IPO) out of the debates in regard to the current bushfire crisis is that the situation is potentially about to get a whole lot worse. A 2017 article in The Conversation warns that:
There’s [an] important piece of nature’s puzzle in the Pacific Ocean that isn’t often discussed.
It’s called the Interdecadal Pacific Oscillation, or IPO, a name coined by a study which examined how Australia’s rainfall, temperature, river flow and crop yields changed over decades …
In the negative phase of the IPO (La Tía) the surface temperatures of the Pacific Ocean are cooler than usual near the equator and warmer than usual away from the equator.
Since about the year 2000, some of the excess heat trapped by greenhouse gases has been getting buried in the deep Pacific Ocean, leading to a slowdown in global warming over about the last 15 years. It appears as though we have a kind auntie, La Tía perhaps, who has been cushioning the blow of global warming. For the time being, anyway.
The flip side of our kind auntie is our bad-tempered uncle, El Tío. He is partly responsible for periods of accelerated warming, like the period from the late 1970s to the late 1990s.
The IPO has been in its “kind auntie” phase for well over a decade now. But the IPO could be about to flip over to El Tío. If that happens, it is not good news for global temperatures – they will accelerate upwards.
Next part (part 2): The popular narrative and the unpopular scientific knowledge.
Header image source: J. Martin SCA, adapted from R. Kidson DNR, in Boyes 200610.
References:
- Dong, B., & Dai, A. (2015). The influence of the interdecadal Pacific oscillation on temperature and precipitation over the globe. Climate dynamics, 45(9-10), 2667-2681. ↩
- Boyes, B. (2006). Determining and managing environmental flows for the Shoalhaven River, Report 2 – Environmental Flows Investigations. NSW Department of Natural Resources, August 2006, p. 19. ↩
- Boyes, B. (2006). Determining and managing environmental flows for the Shoalhaven River, Report 2 – Environmental Flows Investigations. NSW Department of Natural Resources, August 2006, p. 19. ↩
- Boyes, B. (2006). Determining and managing environmental flows for the Shoalhaven River, Report 2 – Environmental Flows Investigations. NSW Department of Natural Resources, August 2006, p. 22. ↩
- Boyes, B. (2006). Determining and managing environmental flows for the Shoalhaven River, Report 2 – Environmental Flows Investigations. NSW Department of Natural Resources, August 2006, p. 22. ↩
- Dong, B., & Dai, A. (2015). The influence of the interdecadal Pacific oscillation on temperature and precipitation over the globe. Climate dynamics, 45(9-10), 2667-2681. ↩
- McGowan, H. A., Marx, S. K., Denholm, J., Soderholm, J., & Kamber, B. S. (2009). Reconstructing annual inflows to the headwater catchments of the Murray River, Australia, using the Pacific Decadal Oscillation. Geophysical Research Letters, 36(6). ↩
- Verdon, D. C., Wyatt, A. M., Kiem, A. S., & Franks, S. W. (2004). Multidecadal variability of rainfall and streamflow: Eastern Australia. Water Resources Research, 40(10). ↩
- Verdon, D. C., Kiem, A. S., & Franks, S. W. (2004). Multi-decadal variability of forest fire risk—Eastern Australia. International Journal of Wildland Fire, 13(2), 165-171. ↩
- Boyes, B. (2006). Determining and managing environmental flows for the Shoalhaven River, Report 2 – Environmental Flows Investigations. NSW Department of Natural Resources, August 2006, p. 19. ↩


Bruce,
An interesting and thoughtful piece.
I would draw your attention also to the possible relationship between the 18.6 luni-solar cycle and the Pacific Decadal Oscillation (PDO) and Interdecadal Pacific Oscillation (IPO). An example of a publication that has aimed to draw attention to these phenomena is Impact of the astronomical lunar 18.6-yr tidal cycle on El-Niño and Southern Oscillation. See https://www.ncbi.nlm.nih.gov/pmc/articles/PMC6185980/ .
My late father (see – https://www.theage.com.au/national/scientist-embodied-early-csiro-values-20170616-gwsnap.html) was involved in Bushfire Research in the CSIRO in the 1960’s and early 1970s and became fascinated by the possibilities of quasi cycles across Eastern Australia. He published a very interesting paper with a US based colleague in the International JOurnal of Climatology (see https://rmets.onlinelibrary.wiley.com/doi/abs/10.1002/%28SICI%291097-0088%28199611%2916%3A11%3C1243%3A%3AAID-JOC85%3E3.0.CO%3B2-E) to hypothesise evidence for Luni-Solar and Solar Cycle signals in Australian Rainfall Data.
Bob (my father) and Jim Noble – both ex CSIRO scientists had a short synopsis about aspects of rainfall patterns in Eastern Australia – also touching upon bushfire events in Eastern Australia – in the March 2011 Rangeland Journal newsletter (see https://web.archive.org/web/20150923124223/http://www.austrangesoc.com.au/pages/range-management-newsletter-111.html). In this there is reference to the 18.6 year cycle (if you read this, it can be noted that 2019.8 is a mid epoch year of this cycle).
None of what I am saying here is refuted science, nor are any mechanisms understood. But as has been hypothesised
“The 18.6-yr cycle is caused by the oscillation of the orbital surface of moon around the earth: the surface inclines 23.4° to the equatorial surface of earth on average and this inclination oscillates with the period of 18.613 years with the amplitude of 5.2°11. This 18.6-yr cycle causes the long-term modulation of oceanic tides where amplitudes of diurnal (semi-diurnal) components of K1 and O1 (M2) tides modulate by 11% and 19% (4%) respectively, and the amplitude modulation of the semi-diurnal M2 tide is out-of-phase from the diurnal (K1 and O1) tides11. This tidal modulation causes variations in oceanic vertical mixing variability” (Yasuda, 2018). See also the commentary on the 18.6 year cycle here https://en.wikipedia.org/wiki/Lunar_standstill .
None of this is to cut across anything you are talking about in your piece. But perhaps the Luni Solar cycle adds an extra piece to your giant jig saw puzzle.