Exploring the science of complexity series (part 15): Concept 6 – Phase space and attractors
This article is part 15 of a series of articles featuring the ODI Working Paper Exploring the science of complexity: Ideas and implications for development and humanitarian efforts.
Complexity and systems – Concepts 4, 5, 6, and 7
The next four concepts relate to different aspects of how complex systems – those characterised by Concepts 1-3 – change over time. The causal relationships that play out within complex systems are explained using the concept of nonlinearity (Concept 4) and the sensitivity of complex systems to their starting conditions is highlighted (Concept 5). The overall shape of the system and its future possibilities are described using the idea of phase space (Concept 6). The patterns underlying seeming chaos within complex systems are explained (Concept 7).
Concept 6 – Phase space and attractors
Outline of the concept
The dimensions of any system can be mapped using a concept called phase space, also described as the ‘space of the possible’ 1 2. For any system, the ‘space of the possible’ is developed by identifying all the dimensions that are relevant to understanding the system, then determining the possible values that these dimensions can take3. This ‘space of the possible’ is then represented in either graphical or tabular form. In natural sciences, the prevalence of time-series data means that the phase space can be represented as a graphical map of all of the relevant dimensions and their values. In social scientific thinking, tables of data can be used to apply the same principles. The phase space of a system is literally the set of all the possible states – or phases – that the system can occupy.
Phase space is particularly useful as a way to describe complex systems because it does not seek to establish known relationships between selected variables, but instead attempts to shed light on the overall shape of the system by looking at the patterns apparent when looking across all of the key dimensions. This resonates with a key point raised in Concept 1 – more may be learned about complex systems by trying to understand the important patterns of interaction and association across different elements and dimensions of such systems4. Phase space can be used to enable this kind of learning. By creating such a map of a system, it is possible to characterise how that system changes over time and the constraints that exist to change in the system5.
Detailed explanation
The dimensions of a complex system mutually influence each other, leading to an intricate intertwining6 of these relationships and system behaviours to degrees of nonlinearity and unpredictability. Because of the challenges involved in analysing such systems, scientists studying complex systems have made use of a mathematical tool called phase space, which allows data relating to the dimensions of a system to be mapped rather than solved7. Put simply, phase space is a visual way of representing information about the dimensions of a system. Rather than a graph, which attempts to show the relationships between specific chosen dimensions, phase space maps the possible values of each dimension of the system (akin to drawing the axes of a graph). This is the space within which a complex system displays its behaviour.
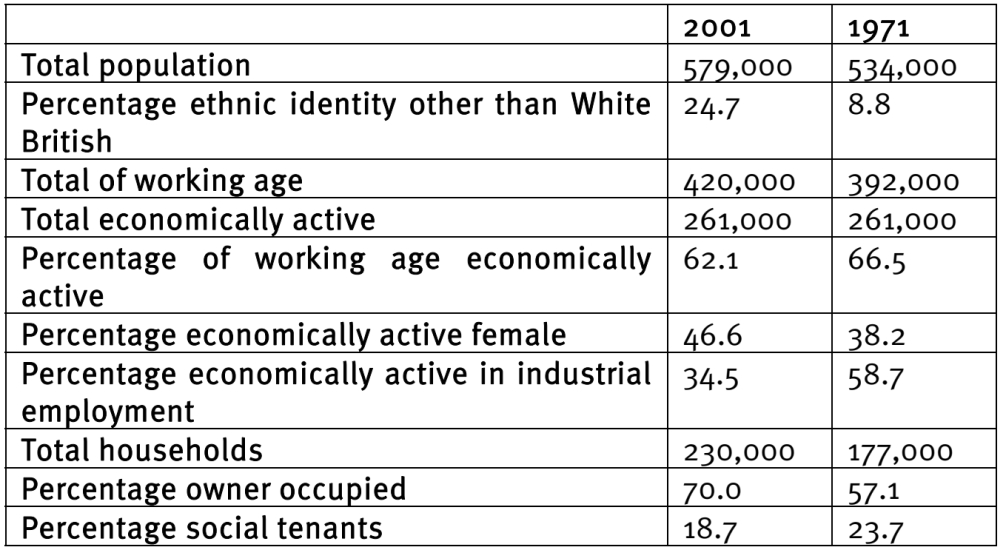
Byrne gives the example of a city as a complex system8. He describes how the cities are complex problems in that they present situations where a range of variables are interacting simultaneously and in interconnected ways. He cites the specific example of Leicester, a city in the UK that grew from a small market town of 2,000 people in the 11th century to a city of 280,000 in 2001. Using the Census data from 2001, he shows that Leicester could be seen as a complex urban system made up of the following variables:
- Total population of the area
- Ethnic composition of the population
- Distribution of the population between urban core and suburban / exurban periphery
- Proportion of population aged 16-74 which is economically active
- Total employed population
- Distribution of the working population by sector of employment
- Distribution of the working population by kind of economic activity
- Distribution of the working population by gender
- Total number of households
- Tenure of households
These variables together represent the individual dimensions of the multi-dimensional phase space of the Leicester urban area. With year on year data over a number of years, this table can represent the phase space of the system. Figure 1 provides a picture of Leicester using two time points.
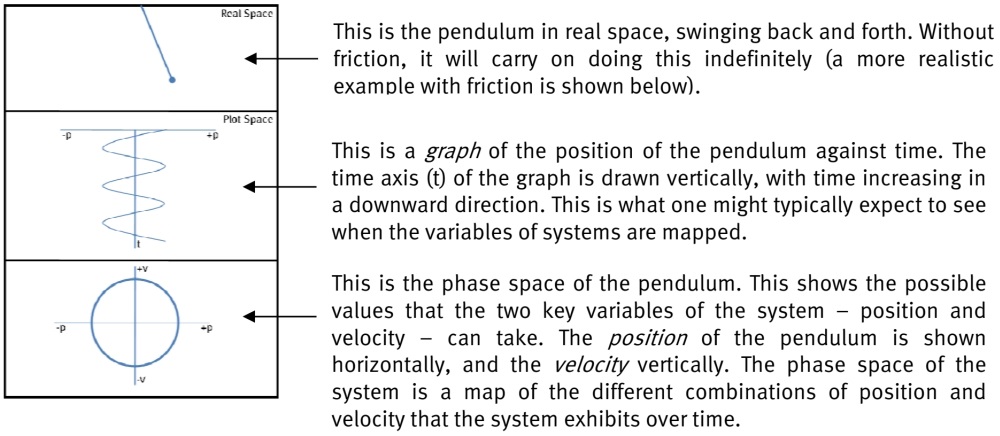
Mapping these data points over time shows that the system moves in a circle or ellipse through this phase space. This loop is called the system’s trajectory in phase space. The trajectory provides a metaphorical map of how the values of the system dimensions change over time. The dimensions of the system at any given point can be represented by a single point which will always be on the trajectory.
In the real world, if friction is taken into account in a pendulum system, the assumption would be that the pendulum would eventually run out of energy and come to a standstill. This is described below.
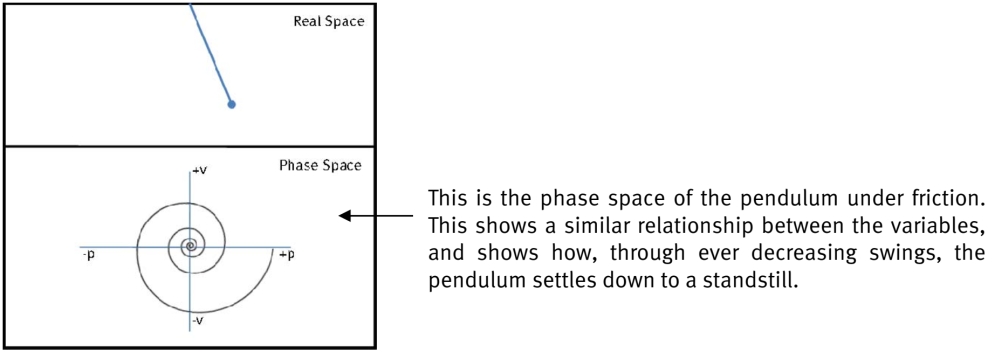
The above examples illustrate how phase space enables an understanding of the evolution of the systems: as the system changes, the point marking its location in phase space also moves. The diagrams show how the variables of the system change and how they are interconnected: the velocity is highest when the pendulum is in the centre of its swing, and moves to zero at either end of swing. A pendulum under friction swings smaller and smaller, until it eventually comes to a stop. The graph of position versus time shown in Figure 2 should help clarify that phase space allows a complementary understanding of the dynamics of a given system.
Phase space, in the sense described above, was developed in the early 20th century, but it is with the advent of computing and new levels of number-crunching power that it has come into its own. The same basic technique described above can be used for systems that are far more complex and have many more dimensions. Computers have enabled tracking of systems with many dimensions and have been used to identify the patterns underlying seemingly complex behaviour.
The ways in which the dimensions evolve and interact leads to different system behaviours in phase space10. The trajectory of a complex system through its phase space may be totally random, such that at any point in time the system could be anywhere in its phase space. Conversely, the system may be limited to a particular part of the phase space – as in the simple example of the pendulum shown above. When observed over time, the points can start to form recognisable patterns. These patterns are known as attractors, and they embody the long-term qualitative behaviour of a
system11.
The first pendulum described above keeps swinging, and so it is said to have a periodic attractor – it moves through its phase space periodically, in repeated ways. The second diagram describes a pendulum that eventually comes to a rest, and so is said to be a point attractor.
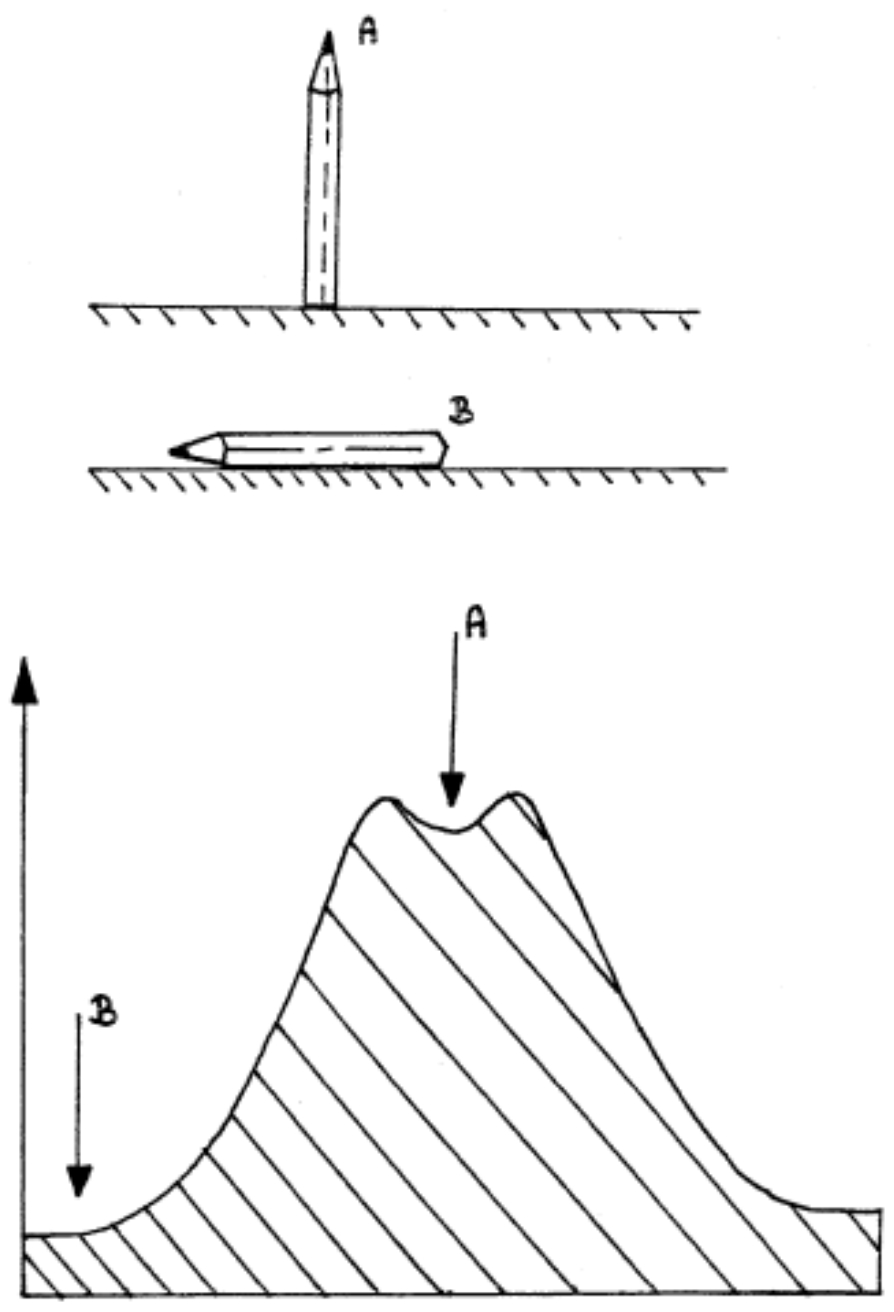
Imagine another simple system of a pencil being put down on its end (see Figure 4). There are two possibilities for how this system could end up – or two attractors. The pencil could end up horizontal, or vertical. In this example, A is possible attractor, but B is the dominant attractor. The lower diagram shows phase space in a different way – in relation to the potential energy of the system.
A higher education system would typically move slowly through its phase space by means of changes in various dimensions – for example, changes in the number of students, in the way that degree examinations are administered, in the results in examinations, or in the number of institutions. The figures for every year may be somewhat different, but not to a degree that will change dramatically the character of the university system.
If, however, new government regulations set a fee for university attendance, which has been free till this moment, a dramatic change will occur. The university may react in too many different ways to the new regulations – it may introduce scholarships, reduce the student places, make some of its staff redundant or cut their salaries or, if there are not enough students enrolling, even close down. This process of sudden movement in the phase space, which is not uncommon for complex systems, is called a phase transition, or ‘bifurcation’, which will be looked at in more detail in Concept 7.
In general, complexity scientists distinguish between conservative systems, which essentially do not have the potential to transform the general shape of their attractor, and dissipative systems, where the form of the attractor may change. The concept of equilibrium is useful here: there might be systems at equilibrium, which do not change their position in phase space; there may be systems close to equilibrium, such that they move back to their original position if disturbed; and there may be systems far from equilibrium, such that radical transformation of the trajectory through phase space is possible. Complex and chaotic systems are described by particular kinds of attractors, which will be described in more detail in Concept 7.
With sufficient data, the phase diagram can be used as a representation (albeit an approximate one) of all the states the system can possibly occupy over time. This has given rise to the term ‘space of the possible’ 16. Over time, the behaviour of a complex system can be mapped by observing the movements of these points within the phase space17 18. Complex social, economic or political systems can be seen to develop within certain economic, ecological, political and socio-cultural constraints, which can be seen as maintaining the boundaries of the phase space of the system19. Though such systems may be unpredictable in their behaviour, there may be patterns describing the boundaries, or the possibility space, of the system’s behaviour. The shape of phase space can therefore be used to uncover and examine aspects of the system that might not be otherwise obvious.
Example: Phase space and understanding socioeconomic exclusion
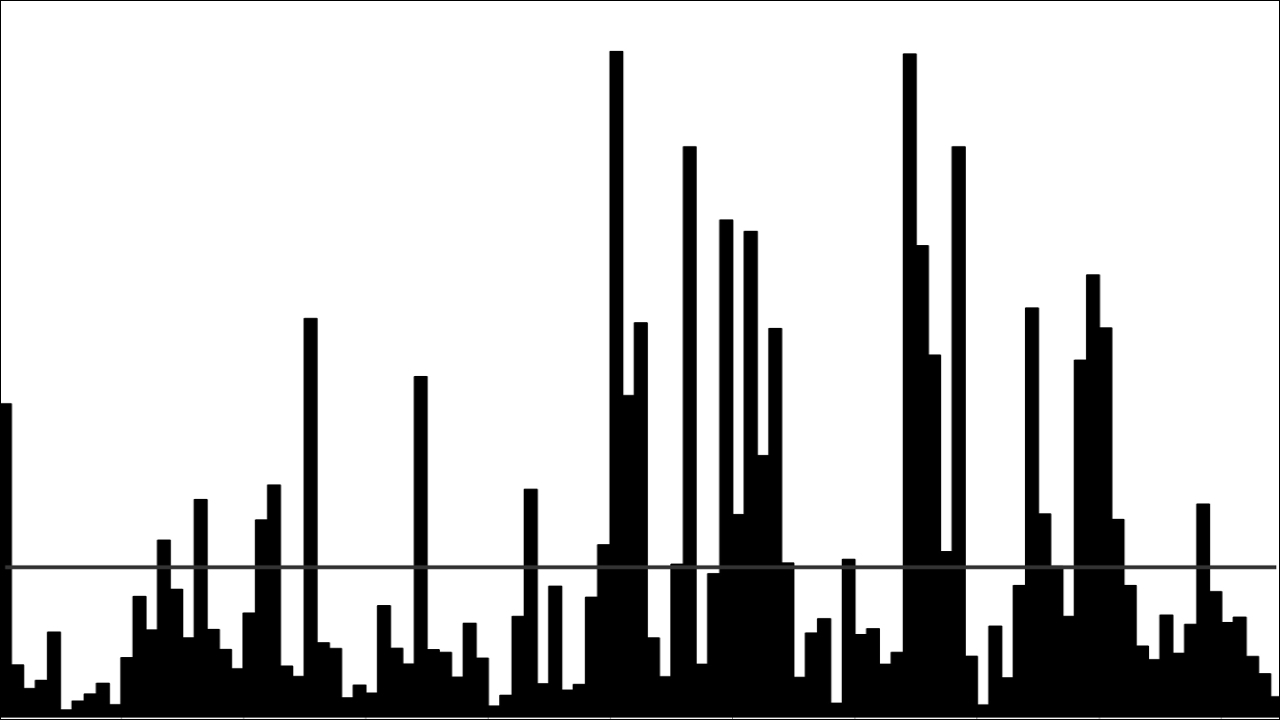
In social sciences, a tabular form of representing data may be used to show phase space of the system20. This can be particularly useful when analysing qualitative data. For example, data below come from a household survey in Cleveland undertaken with over 1,500 respondents. The survey contained a great deal of information about household structure and employment relations. Byrne uses these data to construct a six-dimensional phase space of the households, as shown below.

While some of the potential combinations were not possible because of how data were selected, it was clear that the overall phase space had relatively stable configurations – for example, single parent families were worse off, and their numbers remained reasonably steady over time. By looking at the patterns with many entries, and with few, it is possible to see what phase space conditions are possible in Cleveland at a given point in time. In the example given, exploration of the phase space showed some interesting concentrations. For example, the work poor and young-headed households were very likely to be social housing tenants. The work rich young were more likely to be owner occupiers. Because the Cleveland Social Survey was conducted on an annual basis from 1977 to 1995, it was possible to construct the phase space specified by the six variables for a series of points over time, thereby examining changes in this phase space as a socioeconomic system. During this period, there was a major shift in the attractors for the system. In the late 1970s, social housing was not associated with work poverty. Most very deprived households were female single parent-headed, and there were relatively few of them. By the 1990s, most work poor households were double headed, and the absolute numbers of such households had grown dramatically. They predominated among the social housing tenants in Cleveland. The category of ‘no social class assignable’ became much more significant, because the growth in unemployment meant that there was no employment basis for the assignment of class. In the language of social exclusion, in the late 1970s the attractor of excluded households contained a relative minority of child-containing households in which the households were primarily female headed. By the 1990s, the attractor was much larger in terms of child-containing households, and contained more two-parent households than single-parent households. The phase space analysis shows that exclusion had become de-gendered and had massively expanded.
Implication: Build understanding of the ‘space of the possible’
The concept of phase space suggests complex systems such as those faced by aid organisations are not best understood by simply ‘carving out’ a number of the dimensions and analysing these as a subset. Similarly, it is not ideal to try to understand a variety of causes that have led the dimensions of a system to be the way they are, then moving on to examine each dimension and its cause in isolation. Attempts to understand the system should first identify the key dimensions and track changes in them over time, using this to develop a holistic picture of how the system changes and evolves.
For example, the phase space of an international agency (following Romenska22) would contain dimensions describing the extent to which it is state or privately funded, parameters showing the numbers of staff and offices worldwide, dimensions for the number of programmes and projects and for the number of beneficiaries – the list can be endless. By tracking the changes of all these dimensions over time – the phase space – it is possible to characterise how the organisational system changes in response to internal and external interactions. Certain dimensions may be constant (the number of offices), stable (yearly income from government donors), evolving (the information infrastructure of the organisation), or unpredictable (staff composition). The quest for organisational change will require those involved to appreciate the multiple dimensions of the organisation, which can be influenced and which cannot, which are constrained and by what, and how these issues play out between the different levels of the organisation. Importantly, if certain dimensions cannot be changed, it may be because they are not being addressed at the appropriate level of the organisational system. For example, it may be hard to influence and improve learning processes across international offices, but much easier at the level of teams.
This aspect of phase space highlights an important issue that has been raised recently with regards to changes in humanitarian organisations. As part of a broader look at realistic expectations for change in the humanitarian sector23, it has been suggested that the next five years will see mixed progress in ‘outer realm’ issues of politics, and deeper changes in the ‘inner realm’ of organisational efficiency and effectiveness. If the humanitarian system is seen to develop within broader economic, ecological, political and socio-cultural constraints, then this statement should be qualified carefully with the understanding that the ‘outer realm’ may maintain certain aspects of the system such that the ‘inner realm’ issues are effectively constrained by the lack of progress in the outer realm. A clearer understanding of how the ‘outer’ and ‘inner’ dynamically affect each other would be a useful start.
Fully utilising the concept of phase space calls for aid organisations at least to make an attempt to understand the full range of different dimensions of the systems with which they are dealing, the values these dimensions might take over time, and the implications of this for how the system changes and evolves. Ultimately, there should be effort to contextualise the projects or programmes of an agency within these patterns of system behaviours. Enabling such an understanding shapes how aid projects and programmes are conceived, planned and executed.
Next part (part 16): Concept 7 – Strange attractors and the ‘edge of chaos’.
Article source: Ramalingam, B., Jones, H., Reba, T., & Young, J. (2008). Exploring the science of complexity: Ideas and implications for development and humanitarian efforts (Vol. 285). London: ODI. (https://www.odi.org/publications/583-exploring-science-complexity-ideas-and-implications-development-and-humanitarian-efforts). Republished under CC BY-NC-ND 4.0 in accordance with the Terms and conditions of the ODI website.
Header image source: qimono on Pixabay, Public Domain.
References and notes:
- Cohen, J. and Stewart, I. (1995). The Collapse of Chaos, London: Penguin Books. ↩
- Phase space is often used interchangeably with the phrase ‘state space’. ↩
- Romenska, S. (2006). ‘Innovation in Higher Education Systems in the Post-socialist Countries in Central and Eastern Europe, 1999-2005: Possibilities for Exploration through a Complexity Theory Framework’, Research in Comparative & International Education 1(2). ↩
- Haynes, P. (2003). Managing Complexity in the Public Services, Berkshire: Open University Press. ↩
- Musters, C.J.M. de Graaf, H.J. and ter Keurs, W.J. (1998). ‘Defining Socio-environmental Systems for Sustainable Development’, Ecological Economics 26: 243–58. ↩
- Mittleton-Kelly, E. (2003). ‘Ten Principles of Complexity and Enabling Infrastructures’ in Complex Systems and Evolutionary Perspectives of Organisations: The Application of Complexity Theory to organizations, London: Elsevier Press. ↩
- Capra, F. (1996). The Web of Life, London: Flamingo/Harper Collins. ↩
- Byrne, D. (2006). ‘What is an effect?’, Presentation for the Causality Revisited Session at the 2006 International Sociological Association Conference. Durban, South Africa. ↩
- Byrne, D. (2006). ‘What is an effect?’, Presentation for the Causality Revisited Session at the 2006 International Sociological Association Conference. Durban, South Africa. ↩
- Byrne, D. (2001). ‘Complexity Science and Transformations in Social Policy’, Social Issues 1:22, 10/2001. ↩
- Capra, F. (1996). The Web of Life, London: Flamingo/Harper Collins. ↩
- Newell, D (2003). ‘Concepts in the study of complexity and their possible relation to chiropractic healthcare’ in Clinical Chiropractic (2003) 6, 15-33. ↩
- Romenska, S. (2006). ‘Innovation in Higher Education Systems in the Post-socialist Countries in Central and Eastern Europe, 1999-2005: Possibilities for Exploration through a Complexity Theory Framework’, Research in Comparative & International Education 1(2). ↩
- Musters, C.J.M. de Graaf, H.J. and ter Keurs, W.J. (1998). ‘Defining Socio-environmental Systems for Sustainable Development’, Ecological Economics 26: 243–58. ↩
- Romenska, S. (2006). ‘Innovation in Higher Education Systems in the Post-socialist Countries in Central and Eastern Europe, 1999-2005: Possibilities for Exploration through a Complexity Theory Framework’, Research in Comparative & International Education 1(2). ↩
- Cohen, J. and Stewart, I. (1995). The Collapse of Chaos, London: Penguin Books. ↩
- Mendenhall, M., Macomber, J., Gregersen, H. and Cutright, M. (1998) ‘Nonlinear Dynamics: A New Perspective on IHRM Research and Practice in the 21st Century’, Human Resource Management Review 8(1): 5–22. ↩
- Gleick, J. (1987). Chaos: Making a New Science, New York: Viking. ↩
- Musters, C.J.M. de Graaf, H.J. and ter Keurs, W.J. (1998). ‘Defining Socio-environmental Systems for Sustainable Development’, Ecological Economics 26: 243–58. ↩
- Byrne, D. (1998). Complexity Theory and the Social Sciences: An Introduction, London: Routledge. ↩
- Byrne, D. (1998). Complexity Theory and the Social Sciences: An Introduction, London: Routledge. ↩
- Romenska, S. (2006). ‘Innovation in Higher Education Systems in the Post-socialist Countries in Central and Eastern Europe, 1999-2005: Possibilities for Exploration through a Complexity Theory Framework’, Research in Comparative & International Education 1(2). ↩
- Slim, H (2007). Global Welfare: A Realistic Expectation for the international humanitarian system? ALNAP Review of Humanitarian Action No 7, London: ODI. ↩