After a year of slight gains, newspaper circulation fell again in 2014 (though tracking these data is becoming more complicated each year due to measurement changes). Revenue from circulation rose, but ad revenue continued to fall, with gains in digital ad revenue failing to make up for falls in print ad revenue. Despite widespread talk of a shift to digital, most newspaper readership continues to be in print. Online, more traffic to the top newspaper websites and associated apps comes from mobile than from desktop users, and the average visitor only stays on the site for three minutes per visit. And several larger media conglomerates spun off their newspaper divisions as separate companies in an attempt to prevent the newspaper industry’s woes from affecting the health of their broadcast divisions.
Audience
Circulation
After posting slight gains last year, both weekday and Sunday circulation fell around 3% from 2013 to 2014, according to a Pew Research Center analysis of Alliance for Audited Media (AAM) data. The decline in weekday circulation fell almost equally across all categories. This includes top tier newspapers (those with average weekday circulation of 500,000 or more) whose weekday circulation fell 4% in 2014 after seeing a 22% spike from 2012 to 2013. In Sunday circulation, top-tier papers felt less of a blow than others in 2014.
[chart id=”49035″]
Note on circulation picture
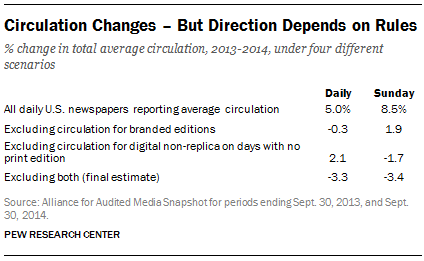
The circulation picture is complicated by rule changes from the circulation auditing body, AAM. Due to these rule changes, AAM recommends avoiding baseline year-over-year comparisons. Thus, our research team adjusted the raw data to allow for valid comparisons.
In 2014, AAM began allowing publishers to report circulation for all so-called “branded editions,” which are editions produced by one publisher but not distributed under that publisher’s flagship name. In early years, branded-edition copies given away for free or included inside another publication were not counted. This addition led to dramatic increases in circulation for some papers.
Publishers were also newly allowed in 2014 to include traffic from mobile applications, even if the app was free, for each day of the week. As a result, some publishers are listed as having digital non-replica circulation even on days they have no print circulation. All circulation for any days on which no print edition was published is excluded from our analysis. Circulation numbers here, then, are the total weekday or Sunday average, excluding branded editions, for days on which a print edition was for sale.
The table below shows what the year-over-year change in total average circulation would have been under four scenarios: 1) with no additional stipulation besides what AAM reported; 2) if circulation of branded editions is omitted entirely for both years; 3) if digital non-replica circulation is omitted for days on which no print edition is distributed; and 4) if both conditions two and three are in place. It is this scenario under which we have arrived at our final number.
Readership
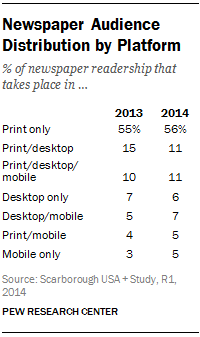
Although the public conversation about newspapers focuses on the shift to digital, most newspaper reading still happens in print. According to readership data from Nielsen Scarborough’s 2014 Newspaper Penetration Report, 56% of those who consume a newspaper read it exclusively in print, while 11% also read it on desktop or laptop computers; 5% also read it on mobile; and another 11% read it in print, on desktop and on mobile. In total, more than eight-in-ten of those who read a newspaper do so in print, at least sometimes. Only 5% read newspapers exclusively on mobile devices.
The general demographics of newspaper readers remain consistent as well. The most likely to read newspapers are those with more education or more income, and who are white.
Economics
For the past five years, newspaper ad revenue has maintained a consistent trajectory: Print ads have produced less revenue (down 5%), while digital ads have produced more revenue (up 3%) – but not enough to make up for the fall in print revenue. Overall ad revenue fell 4%, to just $19.9 billion.
[chart id=”49042″]
Though detailed circulation revenue figures were not available for all publications at the time of writing, such figures are available for seven publicly traded newspaper companies (Gannett, E.W. Scripps, The New York Times Co., A.H. Belo, Journal Communications, McClatchy, and Lee Enterprises; New Media Investment Group is excluded because it purchased a number of new properties in 2014, making one-to-one comparisons with 2013 impossible). For these companies, circulation revenue was up 1%. Newspapers received a roughly similar mix of ad, circulation and other revenue in 2013 and 2014. Last year, the mix was 57% advertising, 36% circulation and 6% other (such as from events or research). For these companies, ad revenues fell nearly equally across categories: down 5% for retail, 6% for national, and 5% for classified.
News Investment
Overall newsroom workforce declined, though the rate of decline is slowing somewhat. According to the American Society of News Editors’ Newsroom Employment Census, after falling 11% in 2008 and 6% in 2012, overall newsroom employment was down 3% in 2013 – the most recent year for which figures are available – to 36,700. The percentage of newsroom employees who are minorities (including Native Americans, African Americans, Latinos and Asian Americans) has remained a steady 11-14% for the past 20 years.
[chart id=”49043″]
The number of female newsroom employees fell little. Women have made up 36-38% of newsroom employees since ASNE began measuring their employment in 1998.
The Los Angeles Register, launched by Freedom Communications in April 2014 as a counterintuitive bet on print, ceased publication the following September – after the similarly failing Long Beach Register (launched in August 2013) was merged into it. These troubles had a negative effect on Freedom’s flagship publication, the Orange County Register, which was so strapped for cash that it asked employees to help deliver the paper. And Digital First Media, one of the biggest newspaper groups in the country, was put up for sale in September, but the sale (to Apollo Global Management, according to reports) has not been finalized.
This is not to say all the news was bad. New Media Investment Group (formerly Gatehouse), which emerged from bankruptcy in 2013 after its holding company purchased the Dow Jones Local Media Group, continued its acquisition spree. Most notably, it announced an acquisition of Halifax Media’s 36 community papers in November.
Digital
In the digital space, many of the newspapers with the highest digital traffic, according to data provided by the analytics firm comScore, are also those with the greatest U.S. circulation – but there are some exceptions. Five UK-based outlets are in the top 25 newspaper websites and associated apps (a list produced through a Pew Research Center analysis of comScore data): the Mail Online (third-highest in traffic on Pew Research’s list), the Guardian (fifth) the Daily Telegraph (tenth), the Mirror (twelfth) and the Independent (fourteenth) – while one of the top U.S. papers by print circulation, the Wall Street Journal, is absent — though this is due to their classification in comScore’s database as “Business/Finance,” not their traffic. (We only analyzed the “General News” and “Newspapers” categories.)
What also stands out in these data is the mix of mobile versus desktop traffic. For 19 of the top 25 newspaper sites and associated apps in overall traffic, mobile traffic exceeded desktop by at least 10%. For five of the 25, the split was about equal (i.e., less than a 10% difference between the two), and for just one – the Houston Chronicle – desktop traffic still accounted for more visits than mobile.
For 13 of the top 25, desktop visitors spent more time on the sites and apps than did mobile visitors (exceeding by at least 10%), while mobile visitors spent more time for five newspapers: the Los Angeles Times, Houston Chronicle, Washington Times, Seattle Times and Newsday. Mobile and desktop visitors spent roughly the same amount of time for seven newspaper web destinations.
For these largest newspapers, their digital audience numbers far outpace circulation: The New York Times reported an average weekday print circulation of less than 650,000 in September 2014. But their website and associated apps attracted nearly 54 million unique visitors in January 2015, and the majority of their paid circulation comes from digital sources (about 1.4 million). Yet far more people report reading a newspaper in print than on a digital device. Why this discrepancy? One clue lies in the time spent. The average visit to The New York Times’ website and associated apps in January 2015 lasted only 4.6 minutes – and this was the highest of the top 25. Thus, most online newspaper visitors are “flybys,” arriving perhaps through a link on a social networking site or sent in an email, and so may not think of this experience as “reading a newspaper” but simply browsing an article online. And from our local news ecology work, we know the vast majority of local residents prefer their local paper to national newspaper brands such as the Times. Despite these massive traffic numbers, only a small portion of newspapers’ revenue comes from digital advertising.