Equilibria and Stability Analysis: Equilibrium Points [Systems thinking & modelling series]
This is part 53 of a series of articles featuring the book Beyond Connecting the Dots, Modeling for Meaningful Results.
Often, we can determine the equilibrium points for a system without fully needing to solve the trajectory for the state variables. Let’s implement the simple disease model we’ve been discussing. We’ll do so for both a differential equation model and a System Dynamics model, but we’ll rely on the differential equation version to do our analytic analysis.
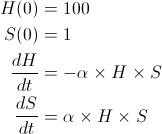
One way to express the differential version of the model is to define two state variables: the number of healthy people (H) and the number of sick people (S). The rate of infection between sick and healthy people can be made a function of the number of people in each category. Clearly, if there are no sick people the infection rate is 0; but, just as clearly, if everyone is already sick then the infection rate will also be zero. One workable differential equation model to implement this behavior is shown below:

This model uses a single parameter (α) to control the infection rate. alpha is a non-zero positive value; the smaller α is, the slower the infection will progress and vice versa. This notation illustrates one of the clumsier aspects of implementing stock and flow models using differential equations. The flow values between two stocks have to be repeated twice; once for each of the two connected state variables’ derivatives.
A model illustrating stable and unstable equilibria using the scenario of an incurable disease in a population can be found in Chapter 8 of Beyond Connecting the Dots.
Analytically, finding the equilibria for differential equation models is by-and-large straightforward. We simply need to harness the definition of an equilibrium point: an equilibrium point is one where the state variables are constant and unchanging. Since the derivatives represent changes in the state variables, this statement is equivalent to saying the derivatives for the model are 0 at equilibrium points.
Based on this, in order to find the equilibrium points we simply need to set the derivatives in our model to 0 and solve the resulting equations. For the disease model we get:

The initial conditions will determine the equilibrium but they do not affect the existence of the equilibria. Furthermore, the two equations we have set to 0 are equivalent1. We can simplify these equations to:
![]()
Simple inspection reveals that this equation is true if and only if either H = 0, S = 0, or α = 0. Thus we have mathematically shown that our equilibria are either when everyone is sick or everyone is healthy (or there is no infection whatsoever). As we said earlier, this is a trivial conclusion for this model. However, for more complex models this type of analysis can be very useful and will often reveal that equilibria are functions of the different parameter values in the model. They may enable you to explicitly determine how the equilibria changes as the model configuration changes.
Let’s try a more complex example. Remember the predator-prey model from earlier? We had the following set of equations to simulate the relationship between a moose and wolf population:
![]()
![]()
Let’s determine the equilibrium values for this model. As before, we start by setting the derivatives to 0:
![]()
![]()
Solving this set of equations is more difficult than for the disease model. However, a little bit of algebra reveals two solutions. The first is when M = 0 and W = 0 (there are no animals at all), and the second is when M = δ ⁄ γ and W = α ⁄ β. This illustrates the dependency of the equilibrium location on the values of the model parameters.
| Exercise 8-2 |
|---|
| Find the equilibrium points for the system:
|
| Exercise 8-3 |
|---|
| Find the equilibrium points for the system:
|
| Exercise 8-4 |
|---|
| Find the equilibrium points for the system:
|
| Exercise 8-5 |
|---|
| Find the equilibrium points for the system:
|
| Exercise 8-6 |
|---|
| Do the locations of equilibria depend on the starting conditions? Does the system arriving at an equilibrium depend on the starting conditions?
Why or why not? |
Next edition: Equilibria and Stability Analysis: The Phase Plane.
Article sources: Beyond Connecting the Dots, Insight Maker. Reproduced by permission.
Header image source: Beyond Connecting the Dots.
Notes:
- Although we expressed this model as a function of two state variables H and S, it only has one independent state variable. Given the fixed population size, you know the value of H given S and vice versa. ↩


