Models and Truth: Predictive versus Narrative Modeling [Systems thinking & modelling series]
This is part 37 of a series of articles featuring the book Beyond Connecting the Dots, Modeling for Meaningful Results.
As we can see, inferential techniques can be categorized as being based on narrative modeling methods or based on predictive modeling methods. So – and this is a key advance – although there are three categories of model purposes – prediction, inference, and narrative – there are only two fundamental approaches to constructing models – predictive modeling and narrative modeling.
This divide is not traditionally used in the modeling field, but it is truly at the heart of modeling. Understanding the distinction between these two types of modeling proves below to be much more valuable than mastering fine technical details. The choice of whether to build a predictive or a narrative model is a fundamental one that shapes every aspect of a model and determines its ultimate utility for a specific purpose. The following sections will describe these two types of models in more detail.
Predictive Models
How do we define a predictive model? The naive answer is that a predictive model is one that makes predictions. If a model generates predictions for a future outcome or a given scenario, then it must be a predictive model. By this definition, a weather forecast is a predictive model as were the Obama administration’s unemployment predictions we saw earlier.
Unfortunately, this straightforward definition is useless. Worse than being useless, it is actually quite dangerous.
Let us propose a model for next year’s unemployment figures in the United States:
Generate a random number from 0 to 1. If the number is less than 0.1, unemployment will be 20%. If the number is greater than or equal to 0.1, unemployment will be 0%.
There, we have just constructed a model of unemployment. Furthermore, our model creates predictions. With just a few calculations we can forecast unemployment for the coming year. Isn’t that convenient?
Of course, this model is a joke. It is useless in predicting unemployment. However, using the naive definition of what it means to be a predictive model, it would be classified as one.
What makes this simple model such a poor model for prediction purposes?
There are several answers. We might start by saying it is too simple. If we are really trying to predict unemployment we should incorporate the current economic state and trends into our model. If the economy is improving, unemployment will probably drop and vice versa. This is a valid point. Let’s address it by proposing an “improved” model:
Generate a random number from 0 to 1. If the number is less than the percentage change in GDP over the past year, unemployment will be 20% plus the current unemployment rate. If the number is greater than or equal to 0.1, unemployment will be the net change in the consumer price index over the past 8 years.
Is this a better model? Clearly, it is more complex than the previous one and it incorporates some relevant economic data and indicators. Equally as clear, however, is that it is also a joke and far from being a useful model.
These toy economic models show that just generating predictions is not a helpful criterion to define a predictive model. They also show that complexity and the use of relevant data is not a valid criterion. So how do we specify a predictive model? The answer is straightforward:
A predictive model is one that not only creates predictions but also must contain an accurate assessment of prediction error.
Read that statement again. The key point is that the assessment of prediction error must be accurate, which is different from the accuracy of the predictions themselves. Of course, ideally the predictions will be accurate; however this is often not possible. Many systems are governed to a significant extent by chance, and no model – no matter how good it is – will be able to create accurate predictions for the systems.
If you know the level of prediction error, you can instead contextualize poorly fitting models. You can determine how much to discount their predictions in your decision-making and analysis. Furthermore, and this is crucial, you can compare different predictive models. If your current model is insufficiently accurate, you can develop another one and objectively test it to determine whether it is better than the current model.
Without measures of predictive accuracy, discussing predictions or comparing models that create predictions is an almost nonsensical endeavor. Such discussions will be governed by political concerns and partisanship, as there is no objective foundation on which to base them.
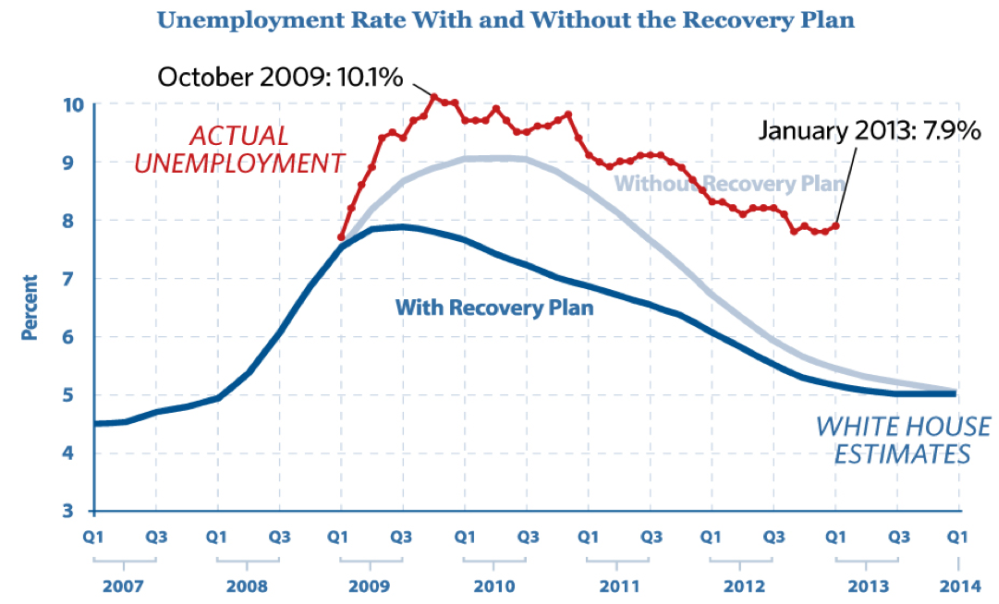
Our two proposed models to estimate unemployment are thus clearly not predictive, as no estimate of predictive error has been established. We can apply this same requirement to Obama’s employment predictions we saw earlier (shown again in Figure 1). When we first presented the model, we called it a narrative model, which might have been slightly perplexing since the model did generate predictions. However, using our above definition of a predictive model we can see that it is in fact not a predictive model. The model contains no estimate of prediction error (and one is not available in the original report) so it simply cannot be considered to be predictive.

If accurate estimates of prediction error are available, you can directly compare the prediction errors between different models to select the one with the lowest error. We could estimate prediction errors for the two joke models we proposed here along with the Obama administration’s model to find the one with the lowest error. We would hope that the one the Obama administration presented to Congress would be the most accurate. Before we test it, however, we must not make the error of erroneously accepting a model to be good based on who presented it to us or its complexity.
Why do we so rarely hear about the predictive accuracy of models? There are numerous reasons but they boil down to three basic ones:
- Accurately assessing prediction error is quite difficult.
- Sharing prediction error may perversely decrease an audience’s belief in a model.
- Most models used for prediction are in reality narrative models and their predictive error is either abysmal or irrelevant.
Let’s look at each point in detail. First consider the issue of the difficulty of assessing prediction error. In general, obtaining an accurate assessment of prediction error is much more difficult than developing the predictions themselves. Most commonly used approaches (for instance the standard R2 from linear regression) have significant flaws. There are both theoretical and numerical methods that can be used to make more accurate prediction errors in many cases (this will be discussed further in the Cost of Complexity section; see also Fortmann-Roe1). When dealing with time series data, however, like most of the models explored in this ILE, it is often almost impossible to accurately assess model prediction error. Theoretical technique to approach these issues have just begun to be developed (e.g., He, Ionides, and King2 or A. A. King et al.3) but they are still impractical to apply in many cases so far.
If the challenge of measuring prediction error is surmounted, there is an even more formidable barrier to its being published with the model. There is a perverse phenomena that the act of reporting prediction error can decrease the confidence an audience gives a model. An anecdote was relayed to us by a member of a team working on a model of disease spread. His team shared the predictions from the model with a group of policy-makers. Everything was going fine until the audience saw the error bars around the predictions. Where his audience had been content with the raw predictions, they were quite unhappy with the predictions when accompanied by their accurately estimated uncertainties. Why was this? Was the team’s model particularly bad or did these policy-makers have a better model at their disposal? No. In a world where policy-makers and clients are constantly shown models (like Obama’s unemployment figures) with no measure of uncertainty (or even worse, poorly calculated, artificially low uncertainty), they come to have unrealistic expectations and often turn away good science in favor of magical thinking.
Finally, the most likely reason supposedly predictive models do not include prediction error is that they simply are not predictive. We have seen how models developed for a purportedly predictive purpose can actually be narrative models in disguise. Why is this too often the case? You need only look at the reason for most modeling projects. It is very rare that models are commissioned solely for the purpose of generating an accurate prediction. Frequently, models are part of some political process within or across an organization (whether an organization be a for-profit company or a non-profit such as a university). Ultimately, those funding the model expect it to prove a point to their benefit. In environments like these, it is to be expected that some predictive modeling efforts will be sidetracked by political concerns or otherwise compromised in the process.
We can see the results of such influences in the predictions generated for unemployment presented earlier. Figure 2 shows the projections for the unemployment rates with and without the stimulus plan just as in Figure 1. Overlaid on this are now the true values of unemployment that occurred after the predictions were made. As is readily evident, the original modeling and predictions were well off the mark. Not only was reality worse than the projections assuming the stimulus was enacted (which it was), it is much worse than the projections for the economy assuming the stimulus had never been enacted at all! This is just a small example – one that is sadly replicated over and over again in business and policy-making – of mistakenly treating a narrative model as a predictive one.
Narrative Models
In contrast to predictive models, a narrative model is one built to persuade and transform an audience’s mental models by telling a story. When people first hear the “narrative” terminology, they often respond negatively. “It’s just a story.” We find this strange, as narratives are the fundamental human form of communication. We tell narratives to our friends and relatives. Politicians communicate their policies to us using narratives. Of course the vast majority of our entertainment is focused on narratives4. Business leaders and managers attempt to describe their strategies to us using story lines; and business books are in general dominated by anecdotes plotted along the way to make their points.
We as a species do not view the world as a collection of numbers and probabilities; instead we see consequence and meaning. In short, narratives are how we see the world.
One critique of the term narrative is that it lacks numbers, quantified data, or mathematics. This could not be further off the mark. There are many ways to construct narratives. Words are one, pictures are another, and music is a third. Numbers and mathematics are just another way of telling a story.
In fact, most statistical and mathematical models are infused with narrative models. We looked earlier at the case of linear regression as a tool to predict test scores as a function of wealth. Again the mathematical equation for this simple model was:
Score = β0 + β1 × Wealth
This equation defines a narrative. Translating this narrative into words, we would say:
Test scores are only determined by the wealth of a student’s family. A child whose family is broke will have a test score, on average, of β0. For every dollar of wealth a child’s family accumulates, the child will score, on average, better on tests by β1.
You might or might not agree with this storyline (in our view it is a nonsensical and reductionist view of child achievement) but it shows the strict equivalence between this mathematical narrative and narrative prose. This process can be applied to all mathematical models. The mathematical definition of the model can be converted directly, with more or less lucidity, into a story describing how the system operates. The same can also be done in the reverse: we can take a descriptive narrative of a system and convert it into a mathematical description. As will be described in The Process of Modeling section, this is what tools like reference models and pattern matching are designed to do efficiently: elicit a narrative from a subject in a way which can be reformulated quantitatively.
The question of how to assess the quality of a narrative model is an important one. With predictive models, we can compare competing models based primarily on predictive accuracy5. But how do we evaluate and compare the quality of narrative models?
The key criterion in assessing a narrative model is its ability to be persuasive. Although persuasion is not an objective measure in the same sense as prediction accuracy, we can decompose persuasiveness into two components for our purposes: believability and clarity. A persuasive model is one that is both believable and effectively communicates its message.
When building a narrative it is very important to use tools that are well suited to meeting these components. Unfortunately, many statistical models, including regressions, are poorly suited to this two-fold task. Most statistical models depend on unrealistic and highly technical assumptions about the data. If these assumptions were enumerated in plain English, they would often conflict with people’s understanding, and in fact end up discrediting the model. The “alternative” has been to leave these assumptions hidden, creating a black box model opaque to outside inspection.
In our view this is a shame. Such a stratagem can be successful if the authority presenting the model is prestigious enough. But the misdirection will quickly fail if any kind of rigorous scrutiny is applied to the model. Narrative models should never be given any real credence if the operation of the model is not transparent. Most statistical models are built on assumptions that are never made transparent to the audience.
The modeling techniques presented in this ILE, on the other hand, are well suited for narrative modeling. The techniques we present are “clear box” modeling where the workings of the model are transparently evident and accessible. We explicitly describe the structure of our models using an accessible modeling diagram that shows the interactions among the different components in the model. The equations governing the model’s evolution are clear and readily available for each part of the model6. Furthermore, the modeling techniques used here make it straightforward to generate animated illustrations and displays to clearly communicate model results.
| Exercise 4-6 |
|---|
| Summarize the distinction between predictive and narrative models. |
Next edition: Models and Truth: Summary.
Article sources: Beyond Connecting the Dots, Insight Maker. Reproduced by permission.
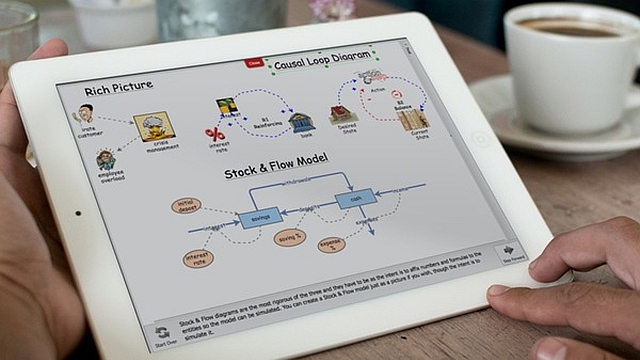
Header image source: Beyond Connecting the Dots.
References and notes:
- Fortmann-Roe, S. (2012). Accurately Measuring Model Prediction Error. http://scott.fortmann-roe.com/docs/MeasuringError.html. ↩
- He, D., Ionides, E. L. and King, A. A. (2009). Plug-and-play inference for disease dynamics: measles in large and small populations as a case study. Journal of The Royal Society Interface 7(43): 271–283. ↩
- King, Aaron A., Edward L. Ionides, Mercedes Pascual, and Menno J. Bouma. 2008. Inapparent infections and cholera dynamics. Nature 454(7206): 877–880. ↩
- Even sports, a form of entertainment that innately contains no narrative, becomes wrapped in narrative as the announcers and commentators attempt to create stories to engage us. ↩
- Other criteria include ease of use, cost of filling data requirements, and computational requirements. But all those are generally secondary to prediction accuracy. ↩
- Admittedly, for complex models it may still require a significant investment on the part of an audience to fully understand the logic and equations in the model. But the opportunity is available. ↩