Systems thinking and modelling series: Model instructions
Interacting with the models used in the systems thinking and modelling series will help you to develop a mastery of systems and feedback. The models are a vital aspect of the interactive learing environment (ILE) created in the innovative book Beyond Connecting the Dots, from which the systems thinking and modelling series has been developed.
Accessing the models
To open each model, click on the link and it will open in a new tab or window in your web browser. The models operate in Insight Maker, a free and powerful simulation tool that runs in your web browser.
Using the models
After you open a model, it will be in storytelling mode. Read the text at the bottom of the screen and step through the story by clicking the “Step Forward” button at the bottom right of the screen.
To start the story again at any time, you can click the “Start Over” button at the bottom left of the screen.
Once you’re finished with the story, you can click the “Exit Story” button at the bottom left of the screen, and then close the tab/window. You can then return to where you were in the article text.
Some of the models simply tell a story by unfolding a model in pictures as you step through it.

Simulations
Some models will actually run simulations as you step though the model.
The storytelling mode will close the graph and continue when you click on Step Forward.
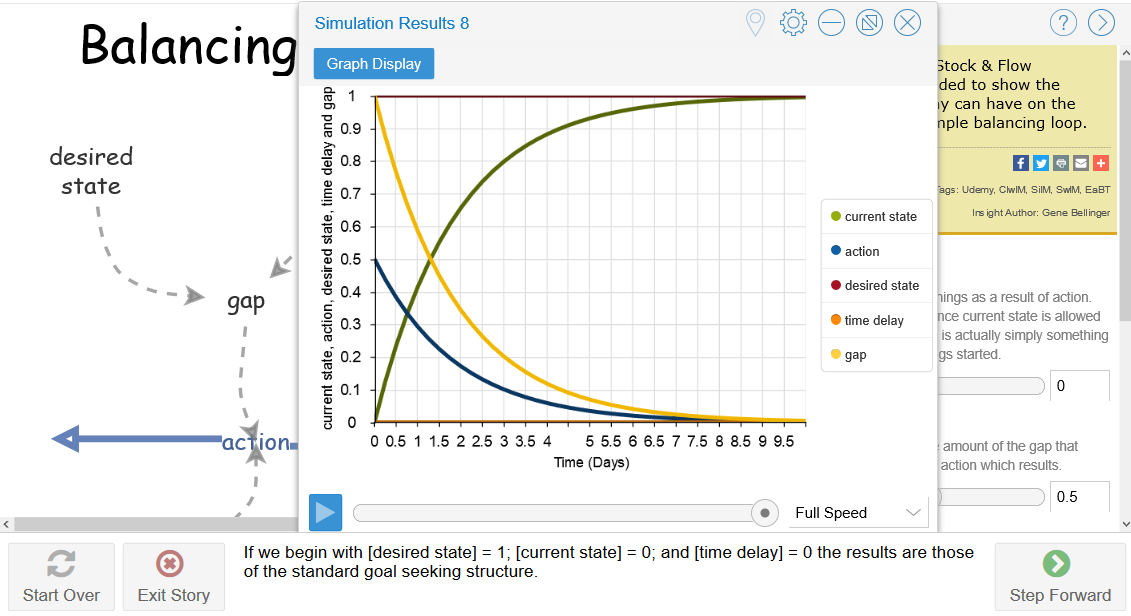
In some models you will be presented with the option to change parameters and then run one or more simulations on your own to get more familiar with the implications of the relationships in the model. The options can be selected in the Configuration Panel shown on the right of Figure 1.
In this mode you can alter parameters and run simulations as many times as you like. Once you’ve looked at the simulation output you’ll have to click the x in the upper right corner of the graph to close it and get back to the model.
Notice in the upper right of the Configuration Panel there is an arrow symbol that points to the right. If you click this it will close the panel, and the arrow will then reverse direction. Click this reversed arrow to reopen the Configuration Panel.
Variable attributes
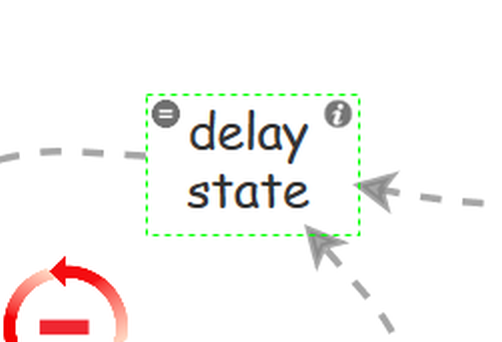
If you click on an element of the model, the Configuration Panel on the right changes to a Variable Panel that shows all the attributes for the element you’ve selected. An example is shown in Figure 3, where the “delay state” element has been clicked, and a Variable Panel appears on the right showing all the attributes for the “delay state” element. After viewing the attributes of an element of the model, you can click anywhere on the model background and the Variable Panel will return to the Configuration Panel depicted in Figure 1.

Notes and equations
For each element in a model, as displayed in the Variable Panel when the element is clicked, there are only two fields you really need to be interested in, so don’t be overwhelmed by all the items. The first is a “Note” field and the second one is an “Equation” field that will have different names depending on which type of model element you select.
When you first click on an element in the model, or hover over it again after having first clicked it, you will see two symbols appear in the top of the small box with a green dashed border that surrounds the element. These are an equal symbol (=) and information symbol (i), as shown in Figure 4.
If you click on the information symbol (i) it will open a dialog box that allows you to read the notes, or if you click on the equal symbol (=) it will open a dialog box that allows you to inspect the equation.
Figure 5 is an example of what the Notes dialog box looks like. Once you’ve finished reading the notes you will need to click the x in the upper right corner of the box to close it.

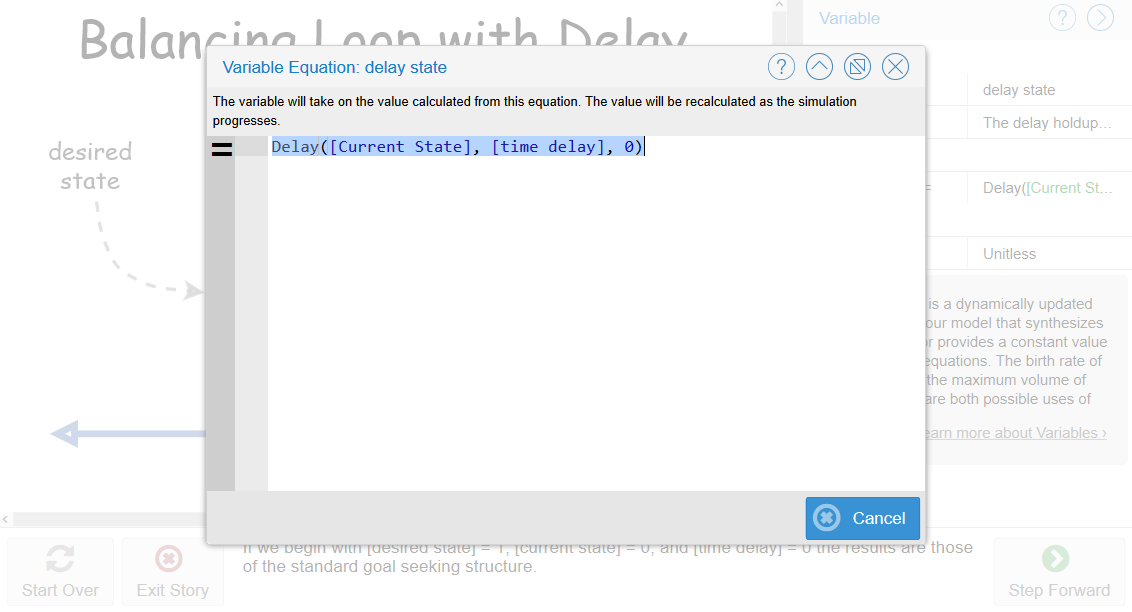
Figure 6 is an example of what the Equations dialog box looks like. Once you have finished inspecting the equation you will need to click the x in the upper right corner of the box to close it.
Article sources: Beyond Connecting the Dots, Insight Maker. Reproduced by permission.
Header image source: Beyond Connecting the Dots.